
FIGURE
Figure 2
- ID
- ZDB-FIG-231116-99
- Publication
- Cella et al., 2023 - Cabozantinib in neuroendocrine tumors: tackling drug activity and resistance mechanisms
- Other Figures
- All Figure Page
- Back to All Figure Page
Figure 2
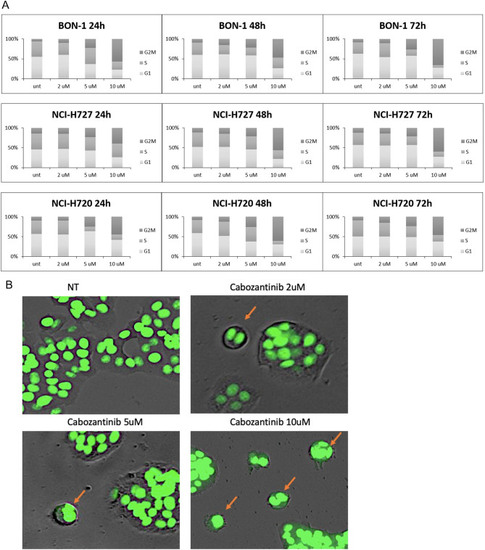
(A) The indicated cell lines were treated (in independent experiments, performed in triplicate) with different doses of cabozantinib (µM), for the indicated times. Distribution of cells in the different phases of cell cycle was measured by propidium iodide. (B) BON1 cells were stained for DNA content: arrows point to cells arrested during mitosis in a polynucleated state. A full-colour version of this figure can be found at |
Expression Data
Expression Detail
Antibody Labeling
Phenotype Data
Phenotype Detail
Acknowledgments
This image is the copyrighted work of the attributed author or publisher, and
ZFIN has permission only to display this image to its users.
Additional permissions should be obtained from the applicable author or publisher of the image.
Full text @ Endocr. Relat. Cancer