
- Title
-
Cabozantinib in neuroendocrine tumors: tackling drug activity and resistance mechanisms
- Authors
- Cella, C.A., Cazzoli, R., Fazio, N., De Petro, G., Gaudenzi, G., Carra, S., Romanenghi, M., Spada, F., Grossi, I., Pallavicini, I., Minucci, S., Vitale, G.
- Source
- Full text @ Endocr. Relat. Cancer

(A) The indicated cell lines were treated (in independent experiments, performed in triplicate) with different doses of cabozantinib (µM), for the indicated times. (B) Percentage of dead cells was measured by exclusion of propidium iodide (PI). Cells were treated as in (A). (C) After 72 h of treatment, cells were plated at low density, and colonies were scored after at least 1 week of incubation (in the absence of the drug). A full-colour version of this figure can be found at |
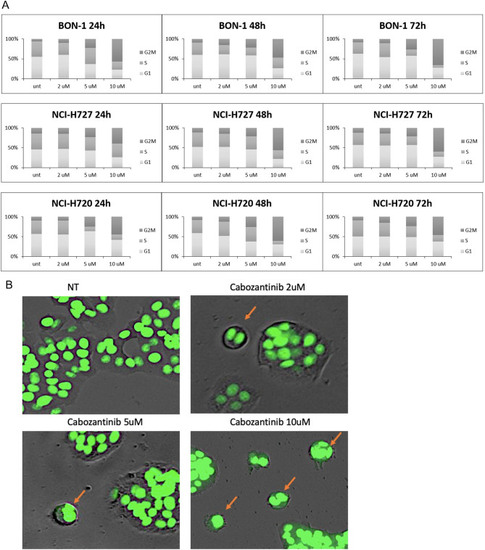
(A) The indicated cell lines were treated (in independent experiments, performed in triplicate) with different doses of cabozantinib (µM), for the indicated times. Distribution of cells in the different phases of cell cycle was measured by propidium iodide. (B) BON1 cells were stained for DNA content: arrows point to cells arrested during mitosis in a polynucleated state. A full-colour version of this figure can be found at |
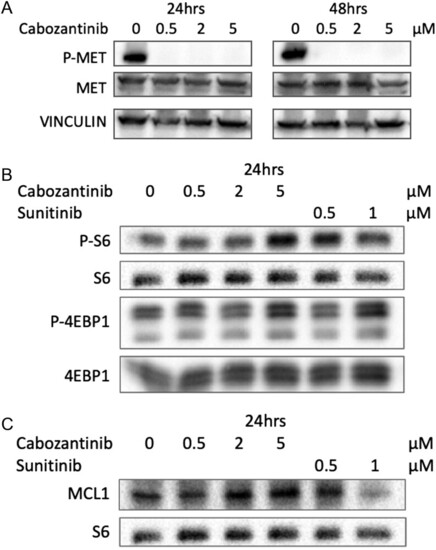
BON1 cells were treated with different doses of cabozantinib or sunitinib (µM), for the indicated times. (A) Analysis of MET phosphorylation. (B) Analysis of mTOR pathway. (C) Analysis of MCL-1 levels. |
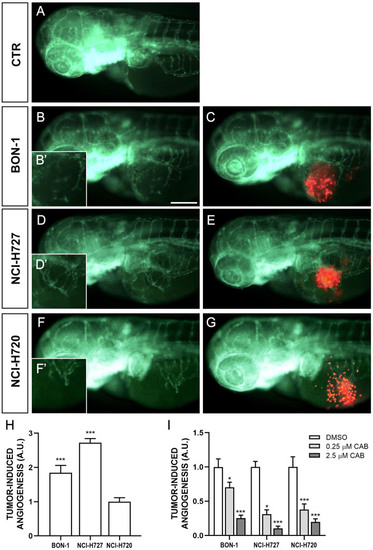
Engraftment of NEN cells in zebrafish embryos. Representative epifluorescence images of |
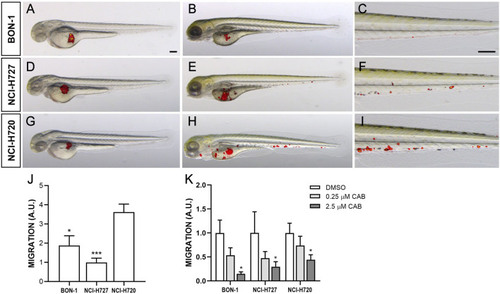
Invasiveness of NEN cells in grafted zebrafish embryos. Overlay of representative fluorescent and bright field images of embryos grafted with red-stained BON-1 (A–C), NCI-H727 (D–F) and NCI-H720 (G–I) cells at 0 (A, D, G) and 48 hpi (B, C, E, F, H, I). For each injected cell line, the tail region was imaged at 48 hpi (C, F, I), showing the spread of NEN cells throughout the embryo body. All images are oriented so that rostral is to the left and dorsal is at the top. Scale bar, 100 μm. The graph J showed the quantification of NEN spread in the tail region at 48 hpi. NCI-H727 value has been set to 1.0. The graph K showed the quantification of NEN spread after 48 h of treatment with DMSO and CAB (0.25 and 2.5 µM). Control (DMSO) values have been set to 1.0. The values reported in the graphs represent the mean ± |
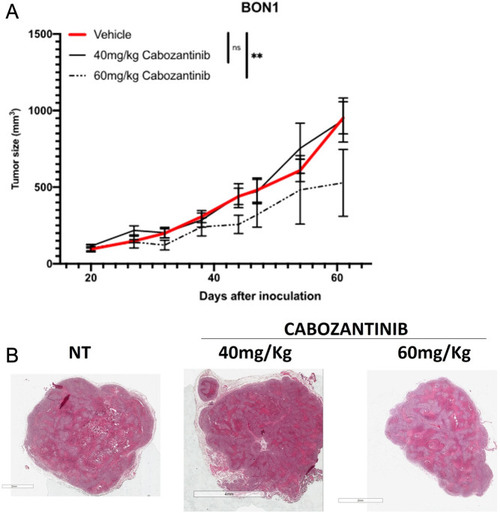
BON1 cells were inoculated into nude mice, and treatment was performed as described in the main text. (A) Tumor size. (B) Representative hematoxylin–eosin staining of tumors at the end of treatment. A full-colour version of this figure can be found at |