FIGURE

Figure 4

ID
ZDB-FIG-231116-101
Publication
Cella et al., 2023 - Cabozantinib in neuroendocrine tumors: tackling drug activity and resistance mechanisms
Other Figures
All Figure Page
Back to All Figure Page
Figure 4

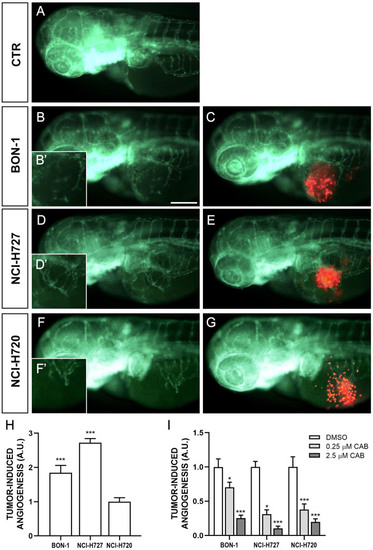
Engraftment of NEN cells in zebrafish embryos. Representative epifluorescence images of Tg(fli1a:EGFP)y1 embryos injected with PBS (control; A) and implanted with red-stained BON-1 cells (B, B’ and C), NCI-H727 cells (D, D’ and E) and NCI-H720 cells (F, F’ and G). Embryos were imaged at 24 h post injection (hpi). The red channel was omitted in panels B, B’, D, D’, F and F’ to facilitate the observation of tumor-induced angiogenesis (green). NEN cells stimulated endothelial sprouting from the SIV plexus within 24 hpi. B’, D’ and F’ are the digital magnification of white-boxed regions. All images are oriented so that rostral is to the left and dorsal is at the top. Scale bar, 100 μm. The graph H showed the quantification of tumor-induced angiogenesis at 24 hpi. NCI-H720 value have been set to 1.0. The graph I showed the quantification of tumor-induced angiogenesis in embryos after 24 h of treatment with DMSO and CAB (0.25 and 2.5 µM). Control (DMSO) values have been set to 1.0. The values reported in the graphs represent the mean ± s.e.m. *P < 0.05;***P < 0.001. A full-colour version of this figure can be found at https://doi.org/10.1530/ERC-23-0232.

Expression Data

Expression Detail
Antibody Labeling
Phenotype Data

Phenotype Detail
Acknowledgments
This image is the copyrighted work of the attributed author or publisher, and ZFIN has permission only to display this image to its users. Additional permissions should be obtained from the applicable author or publisher of the image. Full text @ Endocr. Relat. Cancer