
FIGURE
Figure 3
- ID
- ZDB-FIG-231116-100
- Publication
- Cella et al., 2023 - Cabozantinib in neuroendocrine tumors: tackling drug activity and resistance mechanisms
- Other Figures
- All Figure Page
- Back to All Figure Page
Figure 3
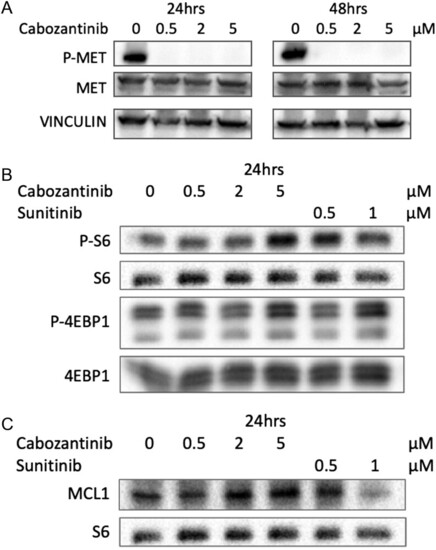
BON1 cells were treated with different doses of cabozantinib or sunitinib (µM), for the indicated times. (A) Analysis of MET phosphorylation. (B) Analysis of mTOR pathway. (C) Analysis of MCL-1 levels. |
Expression Data
Expression Detail
Antibody Labeling
Phenotype Data
Phenotype Detail
Acknowledgments
This image is the copyrighted work of the attributed author or publisher, and
ZFIN has permission only to display this image to its users.
Additional permissions should be obtained from the applicable author or publisher of the image.
Full text @ Endocr. Relat. Cancer