
Fig. 8
- ID
- ZDB-FIG-231018-8
- Publication
- Hu et al., 2023 - Single-cell transcriptome profiling reveals diverse immune cell populations and their responses to viral infection in the spleen of zebrafish
- Other Figures
- All Figure Page
- Back to All Figure Page
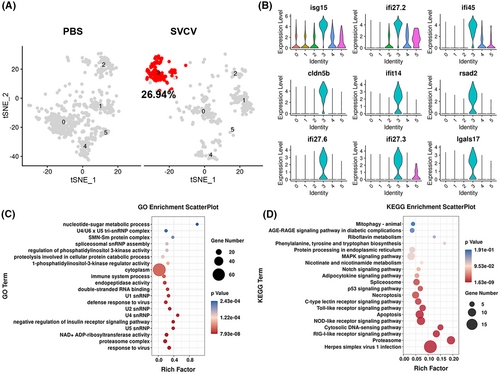
Analysis of the characteristics of cluster 3 HSPCs. (A) tSNE nonlinear clustering was used to visualize the differences in the classification results of the HSPC population between the control group (PBS) and the SVCV-infected group. Cluster 3 cells are denoted by red dots, and numbers represent the percentages of cells in this cluster. (B) Violin plots presenting the top 10 up-regulated expression genes of the cluster 3 cell population distributed in all clusters. Gene expression was normalized, and each graph represents the average expression of the gene in each cluster. (C) GO enrichment analysis of genes in cluster 3. (D) KEGG enrichment analysis of the cluster 3 cell population. |