
Fig. 15
- ID
- ZDB-FIG-231018-15
- Publication
- Hu et al., 2023 - Single-cell transcriptome profiling reveals diverse immune cell populations and their responses to viral infection in the spleen of zebrafish
- Other Figures
- All Figure Page
- Back to All Figure Page
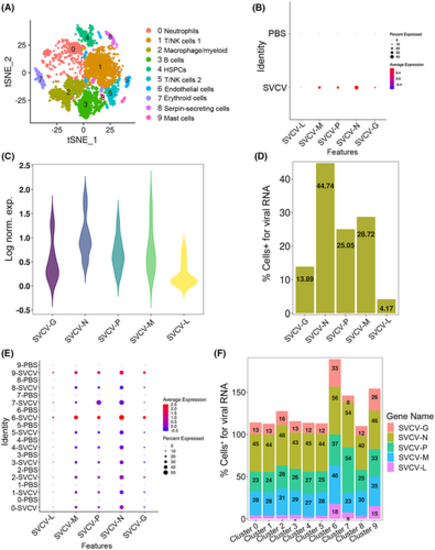
scRNA-seq reveals SVCV-infected cells in spleen tissue. (A) The tSNE nonlinear clustering was used to visualize the classification results of zebrafish spleen leukocyte populations after integrating the nucleic acid sequences of SVCV into zebrafish genome. PCA analysis was performed after the expression of the data was normalized. Dimension reduction was performed by principal component analysis to reduce variables. Then, the clustering algorithm based on graph theory is used to cluster the cells. (B) Dotplots show the level of expression of five SVCV genes and the percentage of cells per cluster that express these genes. (C) The expression of five SVCV genes in the spleen cells was shown as a violin plot. The Y-axis represents the log-normalized expression value. (D) The percentage of cells identified by scRNA-seq that were positive for any reads aligning to the viral genome by SVCV-infected. (E) Dotplots results show five SVCV genes differentially expressing per cluster of immune cells between PBS and SVCV-infected zebrafish. (F) Percentage of cells from the SVCV-infected samples positive for any reads aligning to the viral genome grouped by cell type. |