
Fig. 7
- ID
- ZDB-FIG-231018-7
- Publication
- Hu et al., 2023 - Single-cell transcriptome profiling reveals diverse immune cell populations and their responses to viral infection in the spleen of zebrafish
- Other Figures
- All Figure Page
- Back to All Figure Page
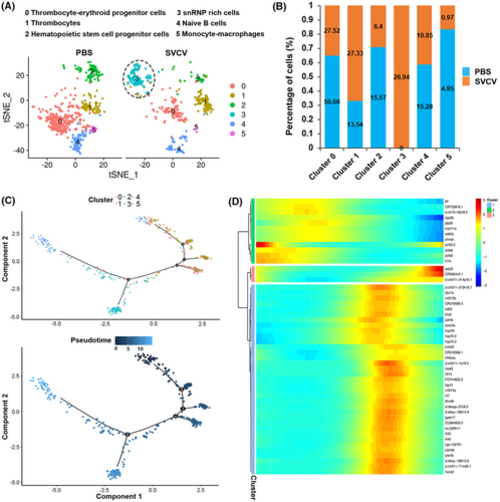
HSPC subtype analysis based on single-cell gene expression. (A) Graph-based clustering of HSPC showing five subclusters in the control group (PBS) and six subclusters in the SVCV-infected group. The novel HSPC subtype in the SVCV-infected group is denoted by a black dotted circle. (B) Histogram showing the differences in the ratios of HSPC subsets between the control group (PBS) and the SVCV-infected group. (C) Pseudotime single-cell trajectory of HSPCs reconstructed by Monocle2. The pseudotime is colored in a gradient from dark to light blue, and its beginning is indicated. (D) Pseudotemporal heat map showing the gene expression dynamics of significant marker genes. Genes (rows) were clustered into three modules, and cells (columns) were ordered in accordance with pseudotime. |