
Fig. 6
- ID
- ZDB-FIG-231018-6
- Publication
- Hu et al., 2023 - Single-cell transcriptome profiling reveals diverse immune cell populations and their responses to viral infection in the spleen of zebrafish
- Other Figures
- All Figure Page
- Back to All Figure Page
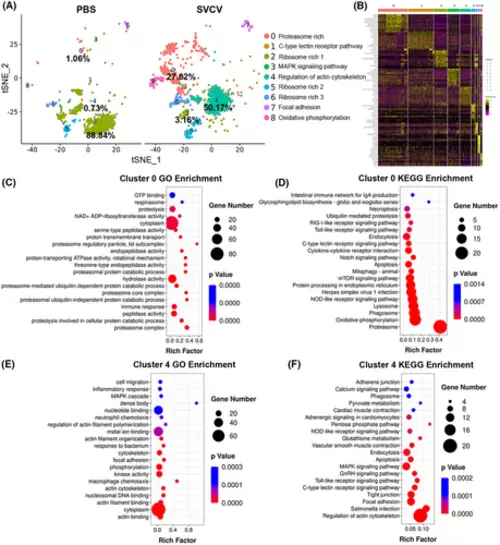
Neutrophil subtype analysis based on single-cell gene expression. (A) Graph-based clustering of neutrophils showing nine subclusters in the control group (PBS) and the SVCV-infected group. The significantly increased and decreased neutrophil subtypes in the SVCV-infected group, where the numbers represent the percentages of cells in each cluster. (B) Heatmap of marker genes from each cluster. Each column in the figure represents a cell subpopulation, and each row represents a gene. (C,D) GO, and KEGG analysis results of cluster 0. RichFactor refers to the ratio of the number of differentially expressed transcripts located in the pathway entry to the total number of transcripts located in the pathway entry in all transcripts. A high RichFactor indicates a high degree of enrichment. The Q value is the p value after multiple hypothesis test correction. The value range is 0 to 1. A value close to zero is indicative of highly significant enrichment. The graph is used to sort the top 20 paths in ascending order on the basis of the Q value. (E, F) GO, and KEGG analysis results of cluster 4. |