
Fig. 11
- ID
- ZDB-FIG-231018-11
- Publication
- Hu et al., 2023 - Single-cell transcriptome profiling reveals diverse immune cell populations and their responses to viral infection in the spleen of zebrafish
- Other Figures
- All Figure Page
- Back to All Figure Page
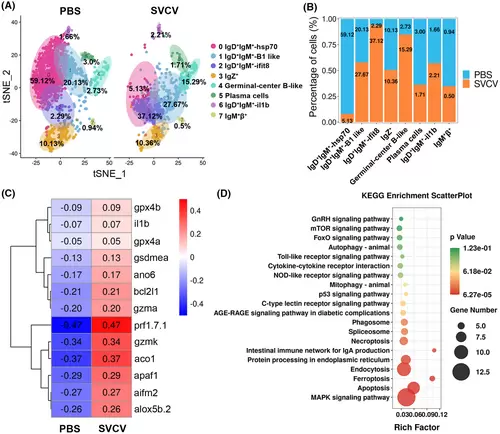
Change in B-cell subtypes in response to SVCV infection. (A) tSNE nonlinear clustering was used to visualize the differences in the classification results of B populations between the control group (PBS) and the SVCV-infected group. (B) Histogram illustrating the differences in B-cell ratios between the control group and the SVCV-infected group. (C) Heatmap of the differentially expressed genes for apoptosis, ferroptosis, necroptosis, and autophagy in the cluster 0 B-cell subset between the control group and the SVCV-infected group. (D) Top 20 most significant KEGG pathways for the cluster 0 B-cell subset. |