
Fig. 9
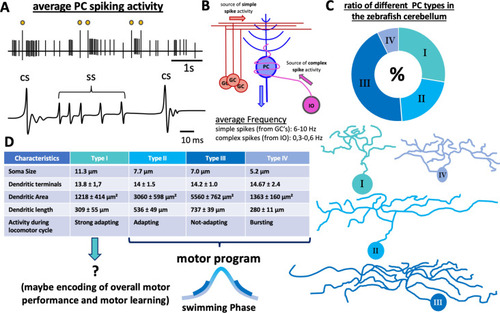
Characterization of Purkinje cell activity and morphology. a Schematic drawing of an electrophysiologic recording performed in a healthy PC at 8dpf. The yellow dots mark complex spikes. The trace underneath shows a detailed view of simple spikes and complex spikes. b Schematic drawing of simplified PC circuitry, showing the two main input sources—parallel fibers (PF) from granule cells (GCs) and climbing fibers (CF) from the inferior olive (IO). c The numerical distribution of the different PC subtypes in the zebrafish corpus cerebellum and schematic drawings of the different morphology of each type. The table in d lists other characteristics of the four different PC subtypes. CS complex spike, GC granule cell, IO inferior olive, PC Purkinje cell, SS simple spike. The graphics and information shown in c, d were taken and adapted from [37] |