
- Title
-
Development, circuitry, and function of the zebrafish cerebellum
- Authors
- Pose-Méndez, S., Schramm, P., Valishetti, K., Köster, R.W.
- Source
- Full text @ Cell. Mol. Life Sci.

The adult zebrafish cerebellum. a Schematic drawing of a sagittal view of the adult zebrafish cerebellum, the individual cerebellar compartments are differently colored. (b provided by Sven Wargenau) Three-dimensional reconstruction of the cerebellum from a cleared brain of an adult Tg(-7.5ca8:EGFP)bz12 zebrafish with green fluorescence in the Purkinje cell population. Note the wing-shaped structures of the valvular lateralis. CC crista cerebellaris, CCe corpus cerebelli, GCL granule cell layer, LCa lobus caudalis, ML molecular layer, PCL Purkinje cell layer, Val valvula lateralis, Vam valvula medialis. Anatomical terminology according to [3] |
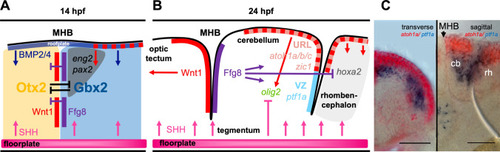
Molecular processes leading to the establishment of a patterned cerebellar primordium in zebrafish. a Schematic drawing of the establishment of the midbrain hindbrain boundary (MHB), a key secondary organizer tissue involved in inducing the cerebellar primordium in the dorso-anterior hindbrain. These processes are already initiated during mid-gastrulation stages, but gene expression is maintained in 14hpf embryos, where it can be assigned well to embryonic neuroanatomical structures. b At 24hpf, the cerebellar primordium is well established and patterned including the two major germinal zones, the upper rhombic lip (URL) and the ventricular zone (VZ) that give rise to all neurons in the adult cerebellum. (c Provided by Andreas Babaryka) Overlay of transmitted light images with results from double in situ hybridization at 36hpf against the mRNA of atoh1a (red) and ptf1a (blue) as molecular markers for these two juxtaposed proliferation zones. Transverse (left) and sagittal (right) vibratome sections through the developing cerebellum are displayed, scale bar. 50 µm. cb cerebellum, MHB midbrain-hindbrain boundary, rh rhombencephalon |

Morphogenetic processes leading to the bilaterally wing-shaped cerebellar primordium in zebrafish. Dorsal views are shown in schematic drawings (a, b) and corresponding images recorded by transmitted light stereomicroscopy (c, d, provided by Martin Distel). cb cerebellum, LRL lower rhombic lip, MHB midbrain–hindbrain boundary, rh rhombomere, URL upper rhombic lip, VZ ventricular zone. Scale bar: 100 µm |

Schematic drawing of developmental steps of cerebellar key neurons and associated gene expression. Granule cells (GCs) as predominant cerebellar interneurons are marked in maroon, Purkinje cells (PCs) as primary output neurons are marked in blue, and eurydendroid cells (ECs) as cerebellar efferent neurons are marked in orange. Sagittal views (anterior to the left) of the developing cerebellum are portrayed with black arrows indicating migration of neuronal progenitors. In the grey box above, expression of key genes in successive stages of PC and EC development is shown, similarly the grey box below lists crucial genes expressed during the developmental course of GCs. Only a selection of commonly used marker genes is shown; for most of these, the exact time of onset and duration of expression have not been systematically revealed. Therefore, a tentative expression onset associated to maturation stages is shown. Solid arrows indicate that expression lasts to adult stages, while arrows with dashed arrowheads indicate that expression in adult stages has not been investigated. URL upper rhombic lip, VZ ventricular zone |

Schematic drawing illustrating intracerebellar connections. CFs climbing fibers, EC eurydendroid cells, GCL granule cell layer, GCs granule cells, GoCs Golgi cells, ION inferior olive nuclei, MFs mossy fibers, ML molecular layer, nMLF nucleus of the medial longitudinal fascicle, PC Purkinje cells, PCL Purkinje cell layer, PFs parallel fibers, SCs stellate cells |
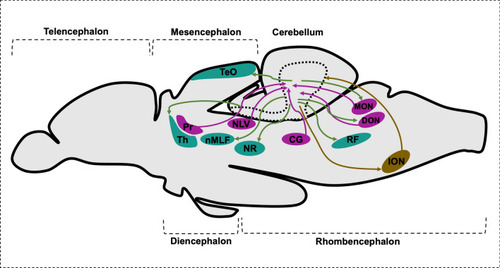
Schematic drawing of sagittal section of brain representing cerebellar afferents and canonical efferent population. CG central gray, DON descending octaval nucleus, ION inferior olive nuclei, MON medial octavolateralis nucleus, NLV nucleus lateralis valvulae, nMLF nucleus of the medial longitudinal fascicle, NR red nucleus, Pr pretectal nuclei, RF reticular formation, TeO optic tectum, Th thalamus |
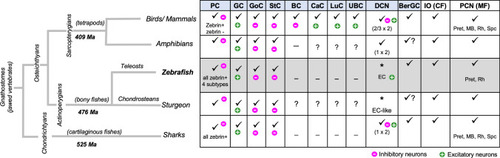
Evolutionary conservation of the main cell types in the cerebellar cortex comparing the zebrafish with those in other groups of jawed vertebrates. BC basket cells, BerGC Bergmann glial cells, CaC candelabrum cells, Cb cerebellum, CF climbing fibers, DCN deep cerebellar nuclei, EC eurydendroid cells (*equivalency to DCN), GC granule cells, IO inferior olive, LuC Lugaro cells, Ma million years ago (molecular dating for nodes of divergence), MB midbrain, MF mossy fibers, PC Purkinje cells, PCN precerebellar nuclei, Pret pretectum, Rh rhombencephalon, Spc spinal cord, StC stellate cells, UBC unipolar brush cells. Information based on: [72, 83–85]. Additional literature was also taken into consideration (see text) |
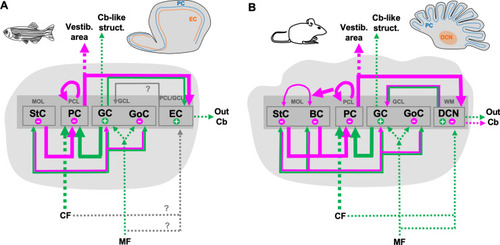
Evolutionary conservation of the cerebellar circuitry in zebrafish. Schematic drawing of the circuitry in the cerebellum of zebrafish (a) compared to that in mouse (b). Thick lines indicate direct connections of the Purkinje cells. Green arrows indicate intracerebellar excitatory input connections, while magenta arrows symbolize intracerebellar inhibitory input. Extracerebellar input or output instead is shown by dashed arrows with excitatory connections shown in green and inhibitory ones marked in magenta. BC basket cells, Cb cerebellum, CF climbing fibers, DCN deep cerebellar nuclei, EC eurydendroid cells, GC granule cells, GCL granule cell layer, GoC Golgi cells, MF mossy fibers, MOL molecular layer, PC Purkinje cells, PCL Purkinje cell layer, PCN precerebellar nuclei, StC stellate cells, WT withe matter. Information mostly based on: [72, 83]. Additional literature was also taken into consideration (see text) |
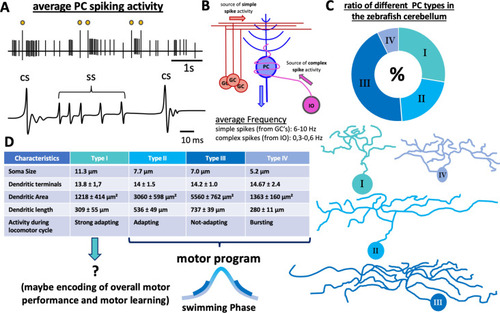
Characterization of Purkinje cell activity and morphology. a Schematic drawing of an electrophysiologic recording performed in a healthy PC at 8dpf. The yellow dots mark complex spikes. The trace underneath shows a detailed view of simple spikes and complex spikes. b Schematic drawing of simplified PC circuitry, showing the two main input sources—parallel fibers (PF) from granule cells (GCs) and climbing fibers (CF) from the inferior olive (IO). c The numerical distribution of the different PC subtypes in the zebrafish corpus cerebellum and schematic drawings of the different morphology of each type. The table in d lists other characteristics of the four different PC subtypes. CS complex spike, GC granule cell, IO inferior olive, PC Purkinje cell, SS simple spike. The graphics and information shown in c, d were taken and adapted from [37] |

Regionalization of Purkinje cells. Schematic drawing of the region-specific Purkinje cell activity triggered by visual stimuli. PCs in the rostromedially region are primarily active when translational motion is detected by the visuo-sensory system and are involved in overall swimming and turning maneuvers (purple). Purkinje cells in the medial region are mostly active when luminance changes are detected and also during motor learning (cyan). The PCs in the caudal region are most prominently active when stimulated by rotational motion and are mainly involved in precise eye and body coordination (yellow). EC eurydendroid cell, GC granule cell, IO inferior olive, PC Purkinje cell. This figure is based on the findings of [97] and was just slightly adapted to fit the style of this review |