FIGURE

Figure 3.

ID
ZDB-FIG-230724-35
Publication
Zhang et al., 2023 - Recruitment of transcription factor ETS1 to activated accessible regions promotes the transcriptional program of cilia genes
Other Figures
All Figure Page
Back to All Figure Page
Figure 3.

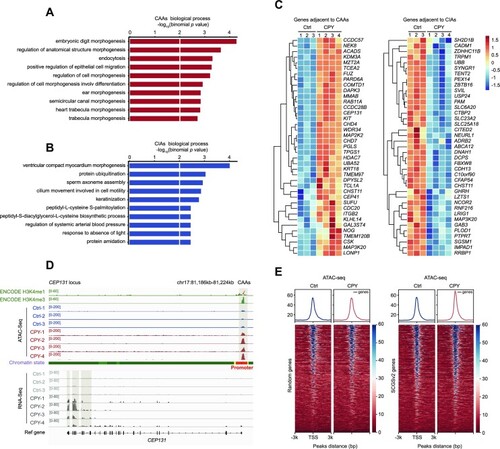
CAAs affect expression profiles of CAA-adjacent cilia genes. (A and B) GO enrichments of (A) CAAs and (B) CIAs using Genomic Regions Enrichment of Annotations Tool (GREAT) analysis. Bar length represents the enriched P-value for biological processes. (C) Heatmaps displaying normalized gene expression among controls and patients. Genes adjacent to CAAs (left panel) and CIAs (right panel) are listed. (D) Snapshot displaying the H3K4me1 and H3K4me3 signals of PBMCs from ENCODE, and the ATAC-seq and RNA-seq profiles of PBMCs at the representative cilia gene CEP131. Vertical grey boxes indicate promoter region ATAC-seq signals and corresponding CEP131 gene expression. (E) Heatmaps and enrichment plots showing normalized read densities of ATAC-seq signals for randomly selected genes (n = 700, left) and SCGSv2 genes (right) in Ctrl and CPY at the TSS. Tracks are centred at the TSS, extending ± 3 kb.

Expression Data

Expression Detail
Antibody Labeling
Phenotype Data

Phenotype Detail
Acknowledgments
This image is the copyrighted work of the attributed author or publisher, and ZFIN has permission only to display this image to its users. Additional permissions should be obtained from the applicable author or publisher of the image. Full text @ Nucleic Acids Res.