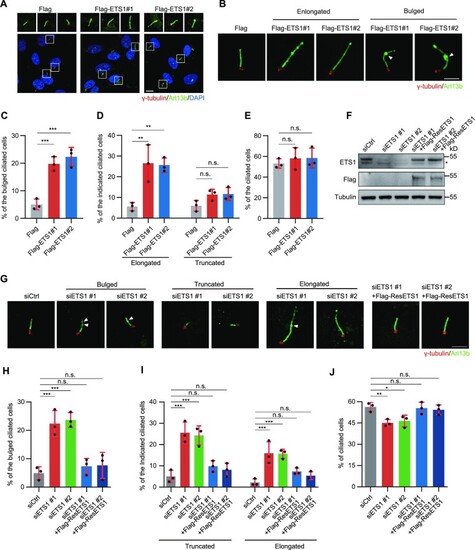
ETS1 positively regulates cilia formation. (A) Immunostaining of γ-tubulin (red) and Arl13b (green) in ETS1-overexpressing hTERT RPE-1 cells. DNA was stained with DAPI (blue). Scale bars, 5 μm. (B) Immunostaining of γ-tubulin (red) and Arl13b (green) in ETS1-overexpressing hTERT RPE-1 cells. Arrowheads indicate the bulge of cilia. Scale bars, 2 μm (C–E) Quantification of the percentage of bulged (C), elongated (left) or truncated (right) (D), and total (E) ciliated cells, from (A) and (B). (F) Immunoblots of ETS1 and Flag expression in control (siCtrl), ETS1-depleted (siETS1) and ETS1-rescued (siETS1 + Flag-ResETS1) hTERT RPE-1 cells. Tubulin was used as a loading control. An asterisk indicates non-specific ETS1 bands. (G) Immunostaining of γ-tubulin (red) and Arl13b (green) in control, ETS1-depleted and ETS1-rescued hTERT RPE-1 cells. DNA was stained with DAPI (blue). Arrowheads indicate the bulge of cilia. Scale bars, 2 μm (H–J) Quantification of the percentage of bulged (H), truncated (left) or elongated (right) (I), and total (J) ciliated cells from (G). For C, D, E, H, I and J, error bars represent the means ± SEM for three independent experiments. n.s., not significant, *P < 0.05, **P < 0.01, ***P < 0.001, as determined using one-way ANOVA.
|
