FIGURE SUMMARY
Title

Recruitment of transcription factor ETS1 to activated accessible regions promotes the transcriptional program of cilia genes

Authors
Zhang, D., Zhang, C., Zhu, Y., Xie, H., Yue, C., Li, M., Wei, W., Peng, Y., Yin, G., Guo, Y., Guan, Y.
Source
Full text @ Nucleic Acids Res.

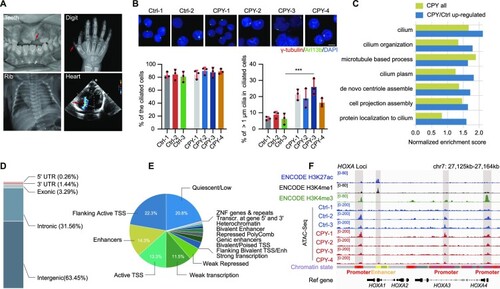
Open chromatin landscape remodelling occurs in EVC ciliopathy patients. (A) Oral, skeletal and radiological results displaying the characteristics of EVC ciliopathy. (B) Immunostaining of γ-tubulin (red) and Arl13b (green) in PBMCs of normal individuals (Ctrl) and EVC-associated ciliopathy patients (CPY). DNA was stained with DAPI (blue) (upper). Quantification of the percentage of ciliated cells (lower left) and cilia > 1 μm in ciliated cells (lower right). ***P < 0.001, as determined using Student's t-test. Scale bars, 2 μm. (C) Cilia-related GO term enrichment scores within EVC ciliopathy and up-regulated EVC ciliopathy genes from the transcriptome dataset. (D) Annotations of the genomic distribution of all peaks identified using ATAC-seq. UTR, untranslated region. (E) Annotations of all open chromatin regions presenting the chromatin states trained using public data of PBMCs from the ENCODE project. TSS, transcription start site. (F) The IGV snapshot displaying the H3K27ac, H3K4me1 and H3K4me3 signals of PBMCs from ENCODE, and ATAC-seq signals of PBMCs in HOXA gene loci. Vertical grey boxes indicate enhancer and promoter ATAC-seq signals. Chromatin states are obtained from ENCODE (red, active promoter; yellow, weak enhancer; orange, strong enhancer; green, transcribed region; and grey, heterochromatin).

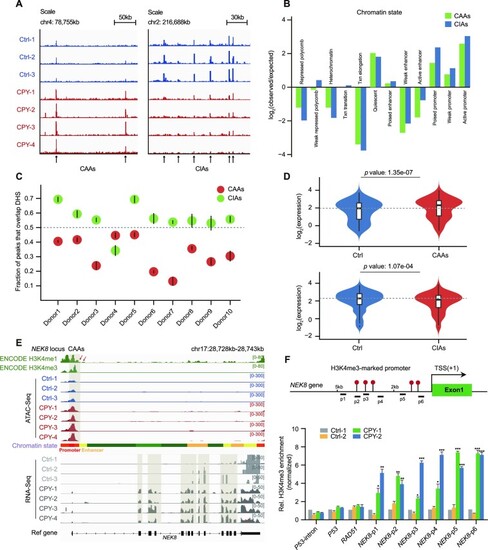
Genome-wide identification and characterization of EVC ciliopathy-related DARs. (A) Insertion tracks of EVC CAAs and EVC CIAs at chromosome 4 (left) and chromosome 2 (right) loci. Differentially open regions are marked with arrows. (B) The defined enrichment of chromatin states at CAAs and CIAs. (C) Overlap of CAAs and CIAs with DNase-hypersensitive sites (DHSs) of PBMCs from 10 healthy donors. Mean overlap with DHS peak calls is shown. Bars represent 95% confidence intervals. (D) Violin plots displaying the distributions of expression changes in CAA- (upper) and CIA-adjacent (lower) genes. (E) Snapshot displaying the H3K4me1 and H3K4me3 signals of PBMCs from ENCODE, and the ATAC-seq and RNA-seq signals of PBMCs in the NEK8 gene locus. Vertical grey boxes indicate the promoter region ATAC-seq signals and corresponding NEK8 gene expression. (F) Location diagram of H3K4me3 ChIP-qPCR primers in the NEK8 locus (upper). The relative levels of H3K4me3 for CAAs in the NEK8 gene measured using ChIP-qPCR in PBMCs (lower). H3K4me3 enrichment for the P53 intron served as a negative control, and H3K4me3 enrichment for P53 and RAD51 served as positive controls, as previously described. The enrichment is normalized to 10% input, while IgG is used as a negative control. Error bars represent the means ± SEM for three independent experiments. *P < 0.05, **P < 0.01, ***P < 0.001, as determined using one-way ANOVA with Dunnett's multiple comparisons test.

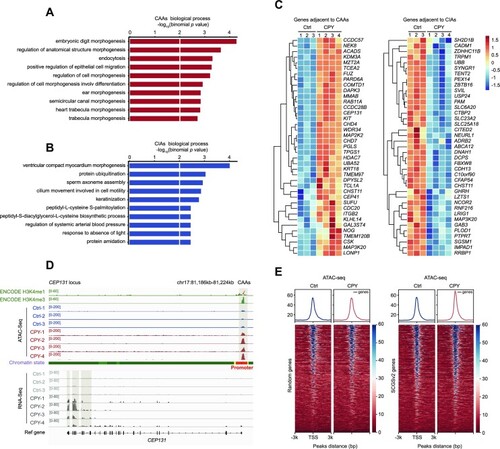
CAAs affect expression profiles of CAA-adjacent cilia genes. (A and B) GO enrichments of (A) CAAs and (B) CIAs using Genomic Regions Enrichment of Annotations Tool (GREAT) analysis. Bar length represents the enriched P-value for biological processes. (C) Heatmaps displaying normalized gene expression among controls and patients. Genes adjacent to CAAs (left panel) and CIAs (right panel) are listed. (D) Snapshot displaying the H3K4me1 and H3K4me3 signals of PBMCs from ENCODE, and the ATAC-seq and RNA-seq profiles of PBMCs at the representative cilia gene CEP131. Vertical grey boxes indicate promoter region ATAC-seq signals and corresponding CEP131 gene expression. (E) Heatmaps and enrichment plots showing normalized read densities of ATAC-seq signals for randomly selected genes (n = 700, left) and SCGSv2 genes (right) in Ctrl and CPY at the TSS. Tracks are centred at the TSS, extending ± 3 kb.

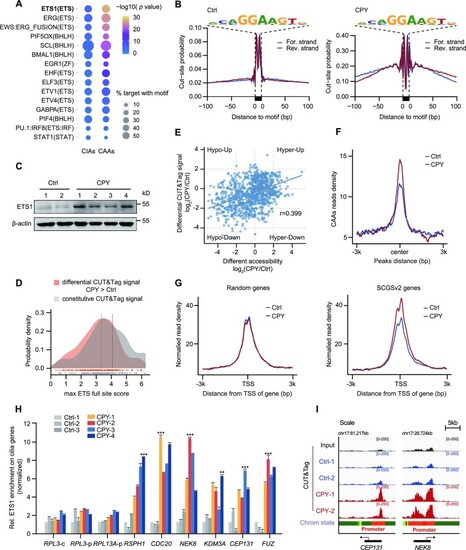
ETS1 is recruited to CAAs and leads to increased expression of cilia genes. (A) Top-ranked enriched motifs among CAAs and CIAs are listed, as determined using HOMER2 algorithms. The circle size represents the percentage of motifs in the target regions, and the colour represents the P-value. (B) ATAC-seq footprint at the ETS motif site in controls and patients. Insertions per site are normalized to have the same average number of insertions 200–500 bp away from the motif. (C) Western blotting analysis of total ETS1 protein expression in Ctrl and CPY. β-Actin was used as a loading control. (D) Distribution of motif scores of sites within ETS1 CUT&Tag peaks in PBMCs, either those that gave more signal in CPY than in the Ctrl (differential) or those that were not significantly different (constitutive). The maximum scoring ETS full site within each CUT&Tag peak was used. The constitutive peaks have a higher mean motif score than the differential peaks (Mann–Whitney U-test, P < 1 × 10−32). (E) Spearman's correlation of differential ETS1 CUT&Tag signals in accessible regions and differential accessibility in CPY versus Ctrl (r = 0.399). (F) The enrichment of ETS1 CUT&Tag signals at CAAs in both Ctrl and CPY. Tracks are centred at the peaks and extend ± 3 kb. (G) Enrichment plots showing normalized read densities of ETS1 CUT&Tag signals at the TSS for randomly selected genes (n = 700, left) and SCGSv2 genes (right) in both Ctrl and CPY. Tracks are centred at the TSS, extending ± 3 kb. (H) The relative levels of cilia genes flanking CAAs in Ctrl and CPY measured using ETS1 ChIP-qPCR in PBMCs. ETS1 enrichment for RPL3-c (coding region) served as the negative control, and ETS1 enrichment for RPL3-p (promoter region) and RPL13A-p (promoter region) served as positive controls, as previously described. The enrichment of ETS1 is normalized to 10% input. **P < 0.01, ***P < 0.001, as determined using one-way ANOVA with Dunnett's multiple comparisons test. (I) IGV snapshot showing the ETS1 CUT&Tag signals of PBMCs in Ctrl and CPY at chromosome 17 loci of cilia genes CEP131 and NEK8.

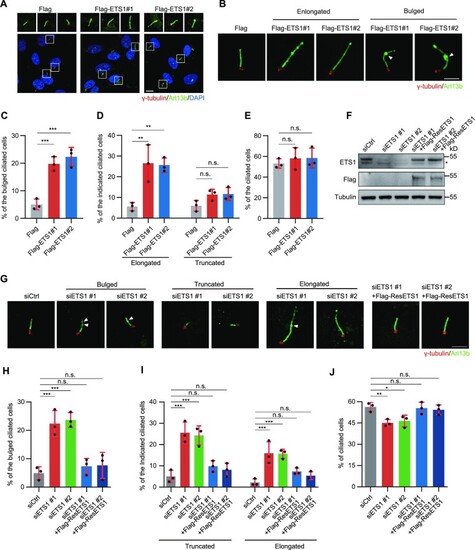
ETS1 positively regulates cilia formation. (A) Immunostaining of γ-tubulin (red) and Arl13b (green) in ETS1-overexpressing hTERT RPE-1 cells. DNA was stained with DAPI (blue). Scale bars, 5 μm. (B) Immunostaining of γ-tubulin (red) and Arl13b (green) in ETS1-overexpressing hTERT RPE-1 cells. Arrowheads indicate the bulge of cilia. Scale bars, 2 μm (C–E) Quantification of the percentage of bulged (C), elongated (left) or truncated (right) (D), and total (E) ciliated cells, from (A) and (B). (F) Immunoblots of ETS1 and Flag expression in control (siCtrl), ETS1-depleted (siETS1) and ETS1-rescued (siETS1 + Flag-ResETS1) hTERT RPE-1 cells. Tubulin was used as a loading control. An asterisk indicates non-specific ETS1 bands. (G) Immunostaining of γ-tubulin (red) and Arl13b (green) in control, ETS1-depleted and ETS1-rescued hTERT RPE-1 cells. DNA was stained with DAPI (blue). Arrowheads indicate the bulge of cilia. Scale bars, 2 μm (H–J) Quantification of the percentage of bulged (H), truncated (left) or elongated (right) (I), and total (J) ciliated cells from (G). For C, D, E, H, I and J, error bars represent the means ± SEM for three independent experiments. n.s., not significant, *P < 0.05, **P < 0.01, ***P < 0.001, as determined using one-way ANOVA.

ETS1 loss induces aberrant expression of cilia genes by remodelling the signals of flanking CAAs. (A) Heatmaps and enrichment plots showing normalized read densities of ATAC-seq signals after down-regulation of ETS1 expression in hTERT RPE-1 cells. Tracks are centred at the peaks and extend ± 3 kb. (B) The enrichment of ATAC-seq signals at CAAs after down-regulation of ETS1 expression in control (siCtrl) and ETS1-depleted (siETS1) hTERT RPE-1 cells. Tracks are centred at the peaks and extend ± 3 kb. (C) Spearman's correlation of CAA accessibility changes and regions that close after ETS1 suppression in hTERT RPE-1 cells (r = –0.727). (D) Enrichment plots showing normalized read densities of ATAC-seq signals from hTERT RPE-1 cells at the TSS for randomly selected genes (n = 700, left) and SCGSv2 genes (right) after ETS1 knockdown. Tracks are centred at the TSS and extend ± 3 kb. (E) IGV snapshot showing the ATAC-seq, CUT&Tag and RNA-seq signals from hTERT RPE-1 cells in loci of KDM3A and SMO genes. (F) Immunoblots of Gli1 and Gli3 in control (siCtrl), ETS1-depleted (siETS1) and ETS1-rescued (siETS1 + Flag-ResETS1) hTERT RPE-1 cells. The intensity of Gli1 and the ratio of Gli3-FL/Gli3-R was quantified. Tubulin was used as a loading control. (G and H) Immunostaining of Gli3 (green) (G) or Smo (green) (H) and γ-tubulin (cyan) in control, ETS1-depleted and ETS1-rescued hTERT RPE-1 cells transfected with mCherry–Arl13b (red) with (right) or without (left) Smoothened agonist (SAG). Scale bars, 1 μm.

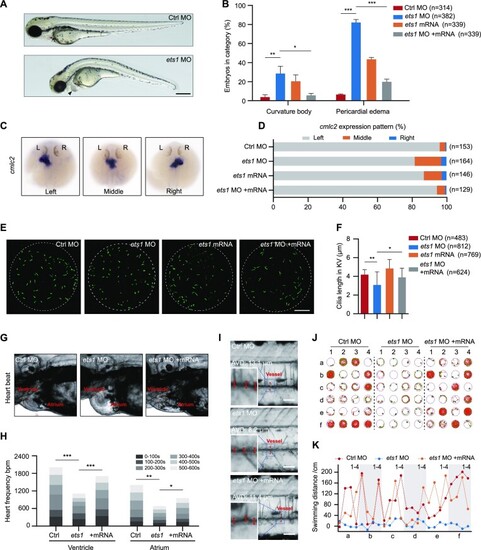
ETS1 expression alteration results in multiple ciliary defects in zebrafish larvae. (A) Representative image of ets1 morphants (ets1 MO, bottom) in bright field showed pericardial oedema and body curvature phenotypes. The arrowhead indicates pericardial oedema. Scale bar, 500 μm. (B) Percentage of embryos exhibiting body curvature and pericardial oedema phenotypes in control, ets1 morphants, ets1-overexpressing (ets1 mRNA) and ets1-rescued (ets1 MO + mRNA) zebrafish larvae. *P < 0.05, **P < 0.01, ***P < 0.001, as determined using Student's t-test. (C and D) WISH results (C) and corresponding statistics (D) of cmlc2 at 30 hpf displayed deficiencies in left–right asymmetry after ets1 knockdown and overexpression. (E and F) Immunofluorescence staining using anti-acetyl-alpha-tubulin antibody at the 8-somite stage (E) and corresponding quantification (F) displayed decreased cilia length in the KV of ets1 morphants. *P < 0.05, **P < 0.01, as determined using Student's t-test. Scale bar, 20 μm. (G and H) The heart rate, expressed in bpm, in the ventricle and atrium over various time intervals for a total time of 10 min. The ventricle and atrium in control, ets1 morphants and ets1 mRNA-rescued larvae are labelled with dashed circles (G). Quantification of the results is shown in (H). *P < 0.05, **P < 0.01, ***P < 0.001, as determined using Student's t-test. (I) The representative blood flow dynamics map of control, ets1 morphants and ets1 mRNA-rescued larvae at 5 dpf. The linear flow meter process was captured in a movie to show the change of blood flow in real time. AVD, average vessel diameter. Scale bar, 100 μm. (J and K) Representative results of locomotion trajectories (J) and swimming distance analysis (K) in control, ets1 morphants and ets1 mRNA-rescued larvae at 5 dpf during a total time of 20 min. The green line represents the trajectory at moderate velocity, and the red line represents the trajectory at high velocity.

Acknowledgments
This image is the copyrighted work of the attributed author or publisher, and ZFIN has permission only to display this image to its users. Additional permissions should be obtained from the applicable author or publisher of the image. Full text @ Nucleic Acids Res.