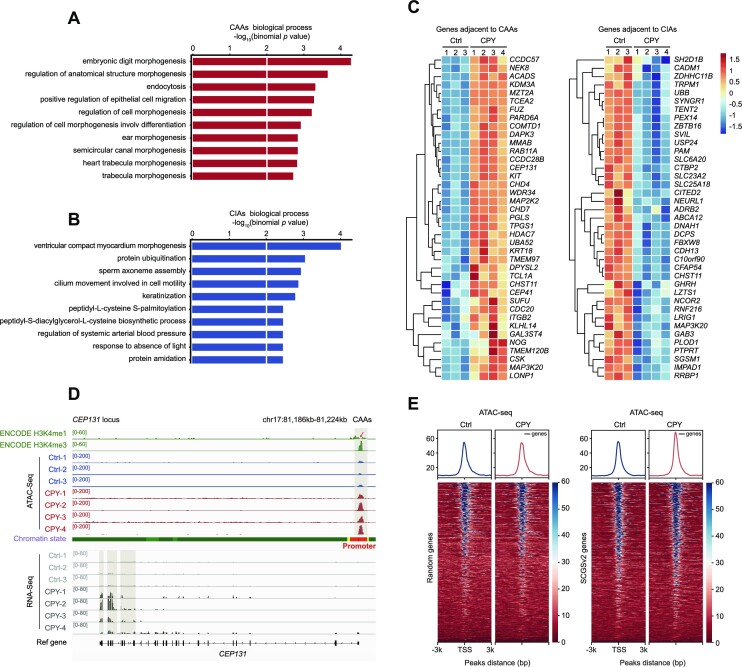
CAAs affect expression profiles of CAA-adjacent cilia genes. (A and B) GO enrichments of (A) CAAs and (B) CIAs using Genomic Regions Enrichment of Annotations Tool (GREAT) analysis. Bar length represents the enriched P-value for biological processes. (C) Heatmaps displaying normalized gene expression among controls and patients. Genes adjacent to CAAs (left panel) and CIAs (right panel) are listed. (D) Snapshot displaying the H3K4me1 and H3K4me3 signals of PBMCs from ENCODE, and the ATAC-seq and RNA-seq profiles of PBMCs at the representative cilia gene CEP131. Vertical grey boxes indicate promoter region ATAC-seq signals and corresponding CEP131 gene expression. (E) Heatmaps and enrichment plots showing normalized read densities of ATAC-seq signals for randomly selected genes (n = 700, left) and SCGSv2 genes (right) in Ctrl and CPY at the TSS. Tracks are centred at the TSS, extending ± 3 kb.
Acknowledgments
This image is the copyrighted work of the attributed author or publisher, and
ZFIN has permission only to display this image to its users.
Additional permissions should be obtained from the applicable author or publisher of the image.
Full text @ Nucleic Acids Res.
Your Input Welcome
Thank you for submitting comments. Your input has been emailed to ZFIN curators who may contact you if
additional information is required.
Oops. Something went wrong. Please try again later.