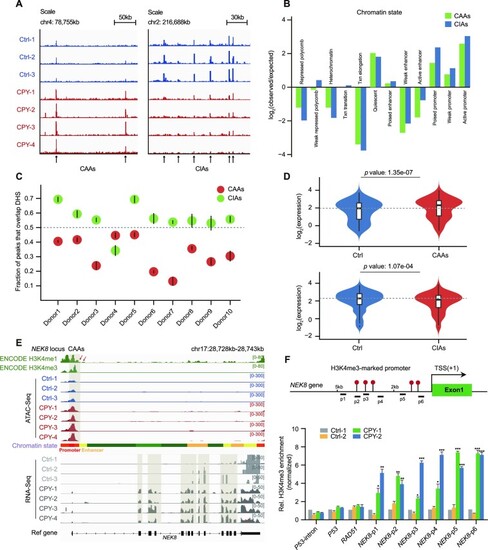
Genome-wide identification and characterization of EVC ciliopathy-related DARs. (A) Insertion tracks of EVC CAAs and EVC CIAs at chromosome 4 (left) and chromosome 2 (right) loci. Differentially open regions are marked with arrows. (B) The defined enrichment of chromatin states at CAAs and CIAs. (C) Overlap of CAAs and CIAs with DNase-hypersensitive sites (DHSs) of PBMCs from 10 healthy donors. Mean overlap with DHS peak calls is shown. Bars represent 95% confidence intervals. (D) Violin plots displaying the distributions of expression changes in CAA- (upper) and CIA-adjacent (lower) genes. (E) Snapshot displaying the H3K4me1 and H3K4me3 signals of PBMCs from ENCODE, and the ATAC-seq and RNA-seq signals of PBMCs in the NEK8 gene locus. Vertical grey boxes indicate the promoter region ATAC-seq signals and corresponding NEK8 gene expression. (F) Location diagram of H3K4me3 ChIP-qPCR primers in the NEK8 locus (upper). The relative levels of H3K4me3 for CAAs in the NEK8 gene measured using ChIP-qPCR in PBMCs (lower). H3K4me3 enrichment for the P53 intron served as a negative control, and H3K4me3 enrichment for P53 and RAD51 served as positive controls, as previously described. The enrichment is normalized to 10% input, while IgG is used as a negative control. Error bars represent the means ± SEM for three independent experiments. *P < 0.05, **P < 0.01, ***P < 0.001, as determined using one-way ANOVA with Dunnett's multiple comparisons test.
|
