|
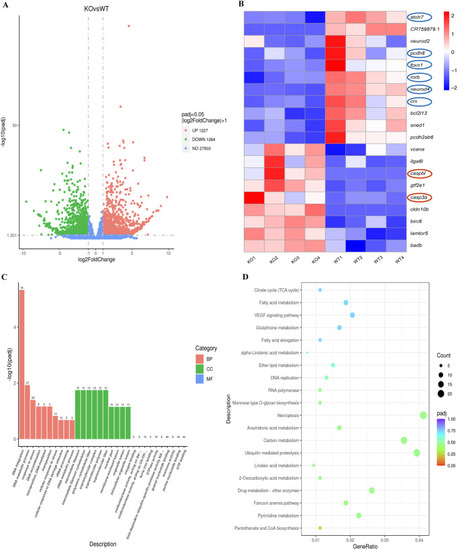
Gene expression changes in flrt2-KO eyes. (A) Volcano plots showing the gene expression differences between flrt2-KO and WT retinas at 36 hpf identified ueing RNA-seq. (B) RNA-seq heatmap showing the DEGs associated with cell adhesion, cell apoptosis, retinal development, and transcriptional regulatory activity in the flrt2-KO and WT eyes (n=40 per group). The heatmap shows upregulated and downregulated genes in red and blue, respectively. The color key represents the normalized data from RNA-seq. (C) Gene ontology enrichment analysis like biological process (BP), cellular component (CC) and molecular functions (MF). (D) Functional pathway enrichment analysis. The DEGs were involved in various KEGG biological pathways.
|