FIGURE

Fig. 1.

ID
ZDB-FIG-230617-49
Publication
Dokmegang et al., 2021 - Quantification of cell behaviors and computational modelling show that cell directional behaviors drive zebrafish pectoral fin morphogenesis
Other Figures
All Figure Page
Back to All Figure Page
Fig. 1.

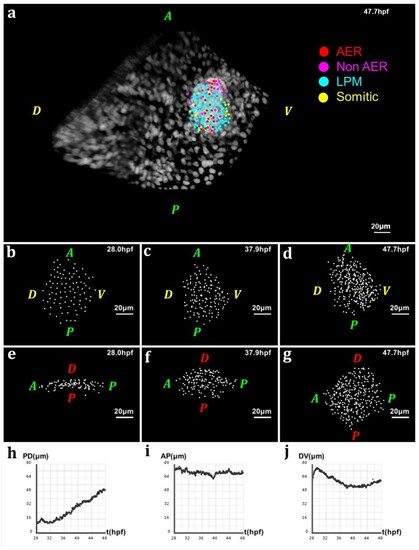
Geometry of the pectoral fin based on live imaging and image processing data. (a) 3D rendering of raw data nuclear staining at 𝑡=47.7 hpf: dorsal view of the zebrafish body with detection of approximate nuclear centers of the pectoral fin cells highlighted by colored dots, where the color code depends on the cell type; scale bar: 20 μm. (b–d) After applying cell detection methods: 3D rendering of the approximate nucleus centers of LPM cells in the pectoral fin at different stages of development, respectively 𝑡=28 hpf, 𝑡=37.9 hpf and 𝑡=47.7 hpf (AP: anteroposterior axis; DV: dorsoventral axis). (e–g) 3D rendering of the pectoral fin at the same times along the AP axis and PD axis. (h–j) Evolution over time of the fin size in μm along the PD, AP and DV axes respectively. Fin expansion occurs mainly along PD. It undergoes a slight compaction along the other two axes, more pronounced along the DV axis

Expression Data

Expression Detail
Antibody Labeling
Phenotype Data

Phenotype Detail
Acknowledgments
This image is the copyrighted work of the attributed author or publisher, and ZFIN has permission only to display this image to its users. Additional permissions should be obtained from the applicable author or publisher of the image. Full text @ Bioinformatics