
Fig. 3.
- ID
- ZDB-FIG-230617-51
- Publication
- Dokmegang et al., 2021 - Quantification of cell behaviors and computational modelling show that cell directional behaviors drive zebrafish pectoral fin morphogenesis
- Other Figures
- All Figure Page
- Back to All Figure Page
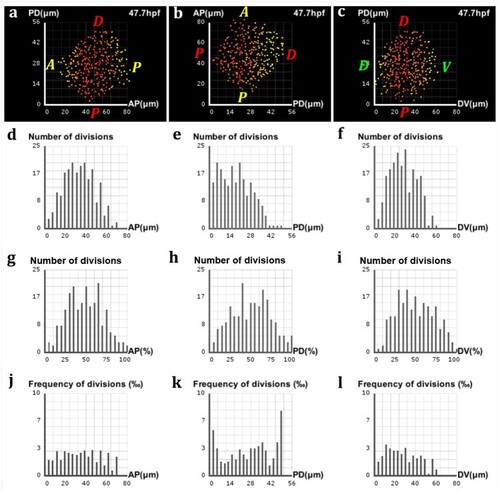
Analysis of proliferation in the zebrafish pectoral fin. (a–c) Frequencies of divisions along the AP, PD and DV axes respectively, highlighted by a yellow-red color gradient coding for differences in proliferation rates across the fin. (a, c) The preponderance of red at the center of the fin shows where the bulk of cell divisions takes place, with only a few of them occurring near the lateral surfaces (yellow). (b) A decreasing gradient of proliferation rates from the proximal pole to the distal tip characterizes the PD axis. (d–f) Marginal distributions of proliferation along the AP, PD and DV axes respectively, expressed in numbers of cells with respect to the absolute distance in μm along the axis. (g–i) Same distributions with respect to the relative distance on the axis. (j–l) Same distributions expressed in proportions of cells with respect to the absolute distance |