Figure Caption
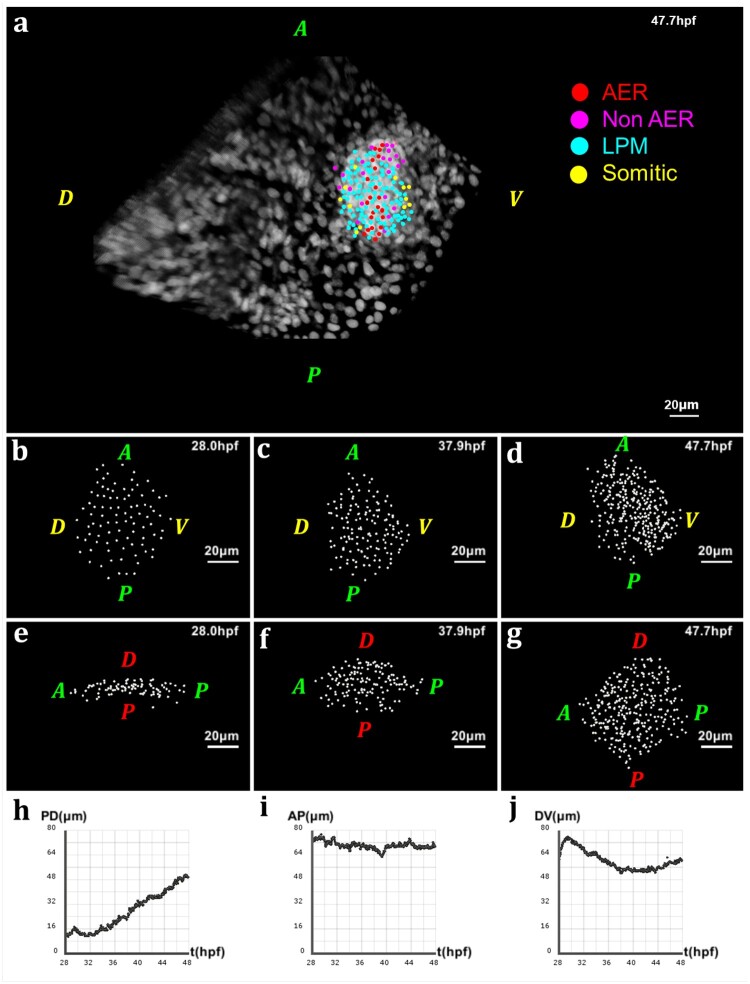
Geometry of the pectoral fin based on live imaging and image processing data. (a) 3D rendering of raw data nuclear staining at 𝑡=47.7 hpf: dorsal view of the zebrafish body with detection of approximate nuclear centers of the pectoral fin cells highlighted by colored dots, where the color code depends on the cell type; scale bar: 20 μm. (b–d) After applying cell detection methods: 3D rendering of the approximate nucleus centers of LPM cells in the pectoral fin at different stages of development, respectively 𝑡=28 hpf, 𝑡=37.9 hpf and 𝑡=47.7 hpf (AP: anteroposterior axis; DV: dorsoventral axis). (e–g) 3D rendering of the pectoral fin at the same times along the AP axis and PD axis. (h–j) Evolution over time of the fin size in μm along the PD, AP and DV axes respectively. Fin expansion occurs mainly along PD. It undergoes a slight compaction along the other two axes, more pronounced along the DV axis