
FIGURE
Fig. 2.
- ID
- ZDB-FIG-230617-50
- Publication
- Dokmegang et al., 2021 - Quantification of cell behaviors and computational modelling show that cell directional behaviors drive zebrafish pectoral fin morphogenesis
- Other Figures
- All Figure Page
- Back to All Figure Page
Fig. 2.
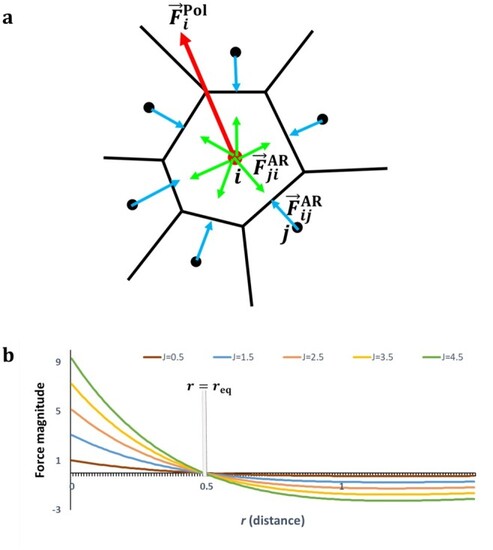
Center-based computational model of multicellular dynamics. (a) Schema of a local cell neighborhood and the abstract forces on cell centers. |
Expression Data
Expression Detail
Antibody Labeling
Phenotype Data
Phenotype Detail
Acknowledgments
This image is the copyrighted work of the attributed author or publisher, and
ZFIN has permission only to display this image to its users.
Additional permissions should be obtained from the applicable author or publisher of the image.
Full text @ Bioinformatics