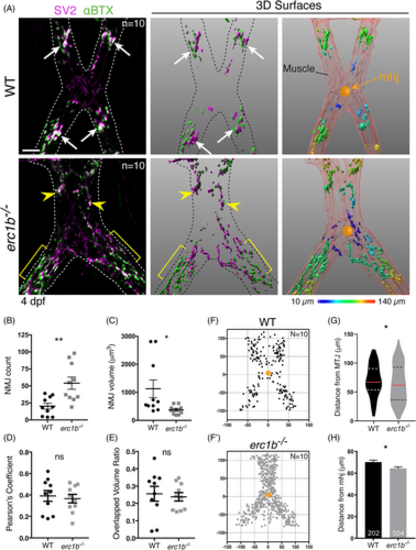
Small, diffusely distributed NMJs appear in Erc1b deficient larvae. A, Left: IF labeling with SV2 (magenta) and αBTX (green); dotted line outlines jaw muscles. Large clusters of NMJs (white arrows) form in WT, erc1b−/− larvae clusters (yellow arrowheads) disperse throughout the tissue (yellow brackets). Middle: Imaris 3D renderings of NMJs. Right: Pseudo-colored NMJs based on the distance from mandibulohyoid junction (mhj, orange ball) (see Section 4 for details). B, Quantification of the number of NMJs, C, NMJ volume, D, SV2/αBTX colocalization Pearson's coefficient, and E, 3D overlap volume ratio in WT and erc1b−/− larvae. Symbols indicate individual embryos (WT N = 10, erc1b−/− N = 10), lines indicate mean with SEM. The location of each NMJ plotted in XY in reference to the mhj (0,0; orange ball) in WT, F, and erc1b−/−, F′, larvae. G, Violin plots of NMJ distance from the mhj (median = red line, upper and lower quartiles = dotted lines). H, NMJ distance to the mhj; bars indicate mean with SEM, total number of NMJs noted at the bottom of each bar (WT n = 202, erc1b−/− n = 504). Mann–Whitney U test (two-tailed) was used for statistical analysis, 95% confidence interval, *P < 0.05, **P < 0.01. All images are maximum intensity projections, ventral views with anterior on top. Scale bars = 25 μm
|
