
Figure 11
- ID
- ZDB-FIG-230506-24
- Publication
- Burrows et al., 2023 - Microscale Neuronal Activity Collectively Drives Chaotic and Inflexible Dynamics at the Macroscale in Seizures
- Other Figures
- All Figure Page
- Back to All Figure Page
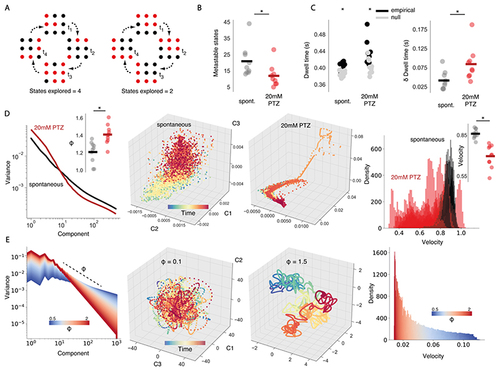
Generalised seizures cause sticky dynamics.
(A) A critical system can explore a greater subset of its possible brain states (left), while a non-critical system will explore a more limited subset (right). (B) The number of metastable states compared across spontaneous (black bar = mean) and 20mM PTZ conditions (red bar = mean). (C) Mean dwell time in each state compared across conditions, plotting both empirical and null model datapoints (left). Empirical dwell time minus null model dwell time (δ dwell time), as a measure of dwell time normalised to number of available states, compared across datasets (right). (D, left) Mean eigenspectrum function plotted across conditions, with Eigenspectrum slope ϕ plotted for each dataset (top right). (D, middle) 3d Isomap embedding of reconstructed attractor for an example fish. (D, right) State space velocity probability densities plotted for all fish, comparing spontaneous and 20mM PTZ conditions, with mean velocity compared across datasets (top right). (E, left) Simulated eigenspectrum function plotted for increasing ϕ. (E, middle) Random projection of eigenspectra into state space for different ϕ. (E, right) State space velocity probability densities plotted as a function of ϕ. * = p<0.01 |