
Figure 10
- ID
- ZDB-FIG-230506-23
- Publication
- Burrows et al., 2023 - Microscale Neuronal Activity Collectively Drives Chaotic and Inflexible Dynamics at the Macroscale in Seizures
- Other Figures
- All Figure Page
- Back to All Figure Page
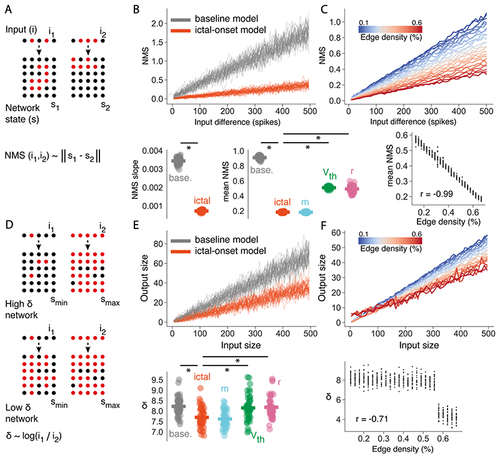
Increased connectivity disrupts the optimal network response properties of critical networks.
(A) For 2 similar inputs (i1 and i2) onto the network, the network mediated separation (NMS) is the Euclidean distance between the two corresponding network states (s1 and s2). (B) NMS is shown as a function of input difference compared for baseline and ictal-onset full parameter models (top). NMS slope and mean NMS is compared for baseline and ictal-onset full models and single parameter models (m = network connectivity, Vth = intrinsic excitability, r=synaptic strength) (bottom). (C) NMS as a function of input difference for increasing network connectivity m, ranging from pre-ictal to ictal-onset m values (top). Correlation between m and mean NMS (bottom). (D) For different inputs, the dynamic range δ is the log ratio of the input sizes (i1 and i2) that give rise to the largest and smallest network responses (Smax and Smin). (E) Output size as a function of input size compared for baseline and ictal-onset full parameter models (top). δ compared for baseline and ictal-onset full models and single parameter models (bottom). (F) Output size as a function of input size for increasing network connectivity m, ranging from pre-ictal to ictal-onset m values. Correlation between m and δ (bottom). * = p<0.01. |