
Figure 1
- ID
- ZDB-FIG-230506-15
- Publication
- Burrows et al., 2023 - Microscale Neuronal Activity Collectively Drives Chaotic and Inflexible Dynamics at the Macroscale in Seizures
- Other Figures
- All Figure Page
- Back to All Figure Page
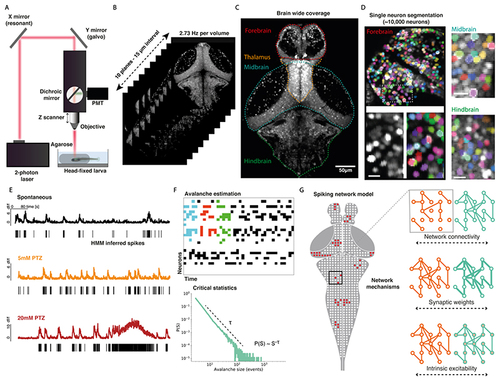
Study design.
(A) In vivo 2-photon imaging setup with head-fixed larval zebrafish. (B) Imaging was captured across 10 planes with 15 μm spacing at an imaging rate of 2.73 Hz per volume. (C) Max projection across 2 imaging planes of larval zebrafish volume taken with 2-photon microscope, demonstrating coverage of major brain regions. (D) Nuclear localised GCaMP fluorescence enables the segmentation of single neurons, as shown over exemplar forebrain (left), midbrain (top right) and hindbrain areas (bottom right) for a representative fish. The two images below the forebrain region show raw GCaMP signal (left) and segmented neurons (right) over a magnified area (scale bar is 10 μm). (E) Single cell traces shown from representative neurons for a single fish, showing normalised calcium fluorescence over time for spontaneous (black), 5mM PTZ (orange) and 20mM PTZ (red) conditions. A hidden Markov model (HMM) was used to infer spike times (black bars). (F) The spatio-temporal propagation of activity through the network was quantified as avalanches, as shown for 3 example avalanches (coloured by avalanche) for an example raster plot (top). Avalanche statistics were calculated to assess critical dynamics (bottom). (G) A network model of the larval zebrafish brain was constructed, which was used to test the role of specific network mechanisms in driving empirical avalanche dynamics. |