
Figure 5
- ID
- ZDB-FIG-230506-19
- Publication
- Burrows et al., 2023 - Microscale Neuronal Activity Collectively Drives Chaotic and Inflexible Dynamics at the Macroscale in Seizures
- Other Figures
- All Figure Page
- Back to All Figure Page
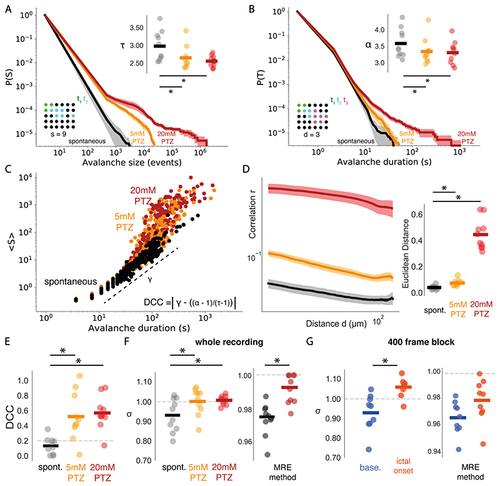
Seizures cause a loss of whole brain critical statistics.
(A) Complementary cumulative distributions for avalanche size (S), showing mean distributions across conditions (shaded regions represent the standard error), with power law exponents T compared (top right) across spontaneous (black), 5mM PTZ (orange) and 20mM PTZ (red) conditions. (B) Same as in (A), for avalanche duration (T) with exponent α. (C) The scaling relationship between S and T is shown by plotting mean S against T and fitting a linear regression line to estimate the exponent γ (dotted line), as shown for spontaneous (black), 5mM PTZ (orange) and 20mM PTZ (red) conditions. DCC is calculated as the absolute difference between γ and (α-1)/(τ-1). (D) The correlation function r(d) compared across conditions (left), with the Euclidean distance from fitted power laws plotted for each condition (right). (E) DCC compared across conditions. (F) The branching parameter σ plotted for each dataset across 30 minute recordings, using avalanche (left) and multiple-regression estimation approaches (right). (G) Same as in (F), for shorter 400 frame state transition periods, where baseline (base.) is before seizure transition and ictal onset is immediately following transition. * = p<0.01 |