
Fig 5
- ID
- ZDB-FIG-230407-25
- Publication
- Nelson et al., 2023 - Integration of cooperative and opposing molecular programs drives learning-associated behavioral plasticity
- Other Figures
- All Figure Page
- Back to All Figure Page
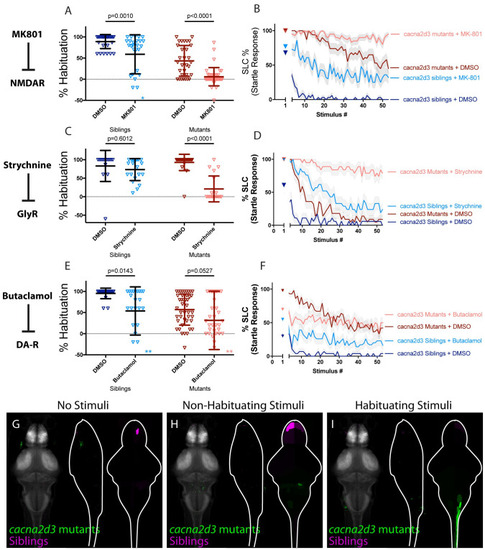
(A-B) MK-801 significantly enhances habituation learning deficits observed in cacna2d3 mutant larvae, indicating that NMDA signaling and cacna2d3 may act within parallel molecular or circuit pathways to regulate habituation learning (p = 0.0010, n = 28 DMSO siblings, n = 27 MK-801 siblings, vs. p<0.0001, n = 31 DMSO mutants, n = 41 MK-801 mutants; p = 0.5130 indicates non-significant interaction between drug treatment and genotype). *indicates a sibling+MK801 individual with a % hab value below y-axis limit at -60% (C-D) Strychnine significantly enhances habituation learning deficits observed in cacna2d3 mutant larvae, indicating that glycine signaling and cacna2d3 may act within parallel molecular or circuit pathways to regulate habituation (p = 0.6012, n = 15 DMSO siblings, n = 21 Strychnine siblings vs. p<0.0001, n = 22 DMSO mutants, n = 19 Strychnine mutants; p<0.0001 indicates significant interaction between drug treatment and genotype owing to minimal reaction of cacna2d3 siblings to Strychnine treatment). (E-F) Butaclamol does not significantly enhance habituation learning deficits observed in cacna2d3 mutant larvae (p = 0.0143, n = 20 DMSO siblings, n = 24 Butaclamol siblings, vs. p = 0.0527, n = 43 DMSO mutants, n = 35 Butaclamol mutants; p = 0.4035 indicates non-significant interaction between drug treatment and genotype). Inspection of the learning curves (F) reveals a dramatic difference in the learning curves of mutants with or without drug. *indicate 2 sibling+Butaclamol and 2 mutant+Butaclamol individuals with % hab value below y-axis limit at -100%, -60%, -256%, and -80% respectively. (G-I) Regions upregulated in cacna2d3 mutants are indicated in green; regions downregulated in cacna2d3 mutants are indicated in magenta. In all images, the left panel is a summed z-projection of the whole-brain activity changes. The middle panel is a summed x-projection of the whole brain activity changes. The right panel is a z-projection of the analyzed MAP-map. Unlike other mutants, cacna2d3 mutants do not exhibit reproducible changes in neuronal activity relative to their siblings in any stimulation condition. See also S1–S3 Tables for ROIs up- and down-regulated in each condition, as well as in independent replicates. |