
Fig 2
- ID
- ZDB-FIG-230407-22
- Publication
- Nelson et al., 2023 - Integration of cooperative and opposing molecular programs drives learning-associated behavioral plasticity
- Other Figures
- All Figure Page
- Back to All Figure Page
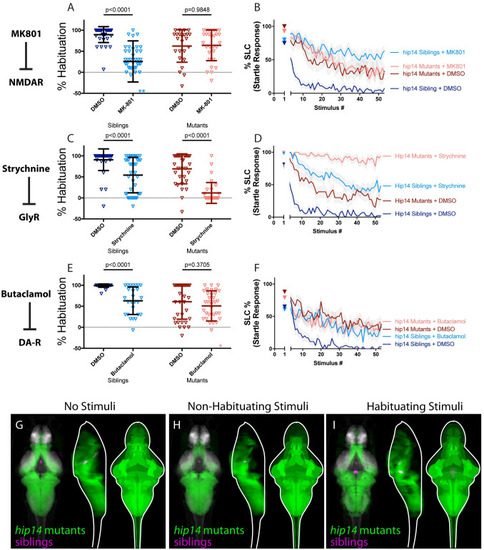
(A-B) MK-801 impairs habituation learning in siblings, (p<0.0001 Sidak’s test for multiple comparisons, n = 38 DMSO, n = 38 MK-801), but does not enhance habituation learning deficits observed in hip14 mutant larvae (p = 0.9848, n = 24 DMSO, n = 29 MK-801, p<0.0001 indicates significant interaction between drug treatment and genotype; these and all subsequent statistical analyses use Two-way ANOVA with Sidak’s multiple comparisons test unless otherwise indicated). **indicate sibling+MK801 individuals with % hab values below y-axis limit at -100% and -180%. (C-D) Strychnine significantly enhances habituation learning deficits observed in hip14 mutant larvae, indicating that glycine signaling and hip14 may act within parallel molecular or circuit pathways to regulate habituation learning (p<0.0001, n = 40 DMSO-siblings, n = 42 Strychnine-siblings, n = 32 DMSO-mutants, n = 32 Strychnine-mutants, p = 0.0639 indicates non-significant interaction between drug treatment and genotype). (E-F) Butaclamol impairs habituation learning in siblings (p<0.0001, n = 33 DMSO, n = 26 Butaclamol), but does not enhance habituation learning deficits observed in hip14 mutant larvae (p = 0.3705, n = 34 DMSO, n = 35 Butaclamol, p = 0.0239 indicates significant interaction between drug treatment and genotype), indicating that dopamine receptor signaling and hip14 may act within the same molecular or circuit pathway to regulate habituation. *indicates a mutant+butaclamol individual with % hab value below y-axis limit at -60%. (G-I) Regions upregulated in hip14 mutants are indicated in green; regions upregulated in siblings (can also be interpreted as downregulated in hip14 mutants) are indicated in magenta. In all images, the left panel is a summed z-projection of the whole-brain activity changes. The middle panel is a summed x-projection of the whole brain activity changes. The right panel is a z-projection of the analyzed MAP-map. Patterns of neuronal activity are similar between “No Stimuli” vs “Non-Habituating Stimuli” vs. “Habituating Stimuli” (restricted diencephalic downregulation of activity; nearly global upregulation of activity across the telencephalon, diencephalon, and rhombencephalon). See also S1–S3 Tables for ROIs up- and down-regulated in each condition, as well as in independent replicates. |