
Figure 5
- ID
- ZDB-FIG-230131-58
- Publication
- Collier et al., 2023 - Neuronal chemokine concentration gradients mediate effects of embryonic ethanol exposure on ectopic hypocretin/orexin neurons and behavior in zebrafish
- Other Figures
- All Figure Page
- Back to All Figure Page
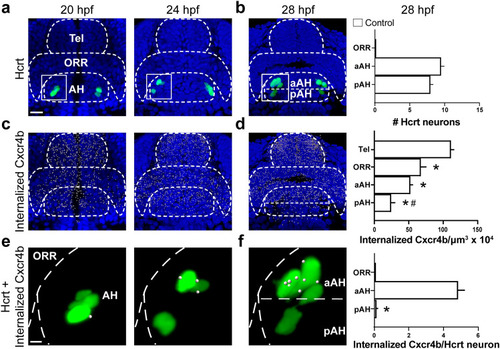
Embryonic development of Hcrt neurons and internalized Cxcr4b under control conditions in 20, 24 and 28 hpf zebrafish brains, as evidenced by immunofluorescence histochemistry. (a) Representative photomicrographs (×25) illustrate the zebrafish brain in a dorsal/ventral view with the pAH, aAH, ORR and Tel of the brain outlined by dashed lines, the Hcrt neurons (green) shown tightly clustered together at 20 hpf while spreading out and increasing in number at 24 hpf, and the cells counterstained with DAPI (blue). (b) Hcrt neurons become more spread apart at 28 hpf, with an equal number of Hcrt neurons detected in the aAH and the pAH and no Hcrt neurons detected in the ORR, as shown in the bar graph (n = 4). (c) Representative photomicrographs show the density of internalized Cxcr4b receptors (white, indicated by digital “spots”) naturally increases from 20 to 24 hpf, and they show a tendency to increase from the AH to the Tel part of the brain. (d) Representative photomicrographs show the internalized Cxcr4b receptors at 28 hpf become more dense and exhibit a natural posterior-to-anterior concentration gradient throughout the brain, with lowest levels in the pAH, moderate levels in the aAH and ORR, and highest levels in the Tel, as shown in the bar graphs (n = 4). (e) Enlargements of boxes at 20 hpf show no Hcrt neurons with internalized Cxcr4b receptors, while internalized Cxcr4b receptors within Hcrt neurons become apparent at 24 hpf. (f) Enlargement of boxes at 28 hpf show an increase in the number of internalized Cxcr4b receptors in Hcrt neurons, with Hcrt neurons located in the aAH showing a greater number than the pAH of these internalized Cxcr4b receptors, as shown in the bar graphs (n = 4). Scale bar: low magnification 20 µm; high magnification 8 µm. *p < 0.05 and #p < 0.05 compared to Tel and aAH respectively. Results are shown as means ± standard errors. AH anterior hypothalamus, aAH anterior part of the anterior hypothalamus, pAH posterior part of the anterior hypothalamus, ORR optic recess region, Tel telencephalon, Hcrt hypocretin, hpf hours post fertilization. |