
Figure 1
- ID
- ZDB-FIG-230131-54
- Publication
- Collier et al., 2023 - Neuronal chemokine concentration gradients mediate effects of embryonic ethanol exposure on ectopic hypocretin/orexin neurons and behavior in zebrafish
- Other Figures
- All Figure Page
- Back to All Figure Page
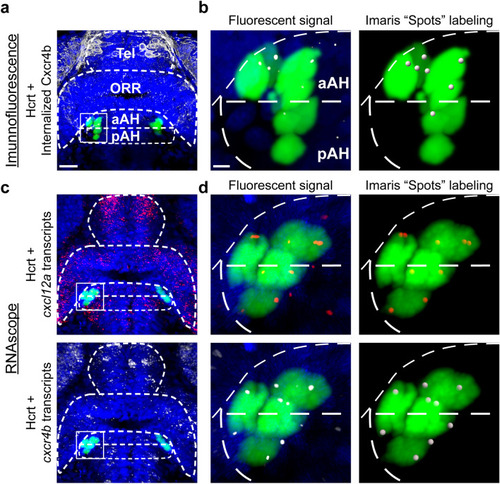
Photomicrographs illustrating the methodology used to quantify internalized Cxcr4b receptors colocalized within Hcrt neurons using immunofluorescence and also cxcl12a and cxcr4b transcripts colocalized within Hcrt neurons using RNAscope. (A) A representative confocal photomicrograph (×25) illustrates the 28 hpf zebrafish brain in a dorsal/ventral view with the aAH, pAH, ORR and Tel outlined by dashed lines. The Hcrt neurons (green) and internalized Cxcr4b receptors (white) are labeled using immunofluorescence, with counterstaining using DAPI (blue). (B) Enlargement of boxes at 28 hpf show the fluorescent signal (left) of the Hcrt neurons and internalized Cxcr4b receptors and the “Spots” labeling (right) of these internalized Cxcr4b receptors within Hcrt neurons using Imaris software for quantification. (C) Representative confocal photomicrographs (×25) show Hcrt neurons (green) with cxcl12a (top, red) and cxcr4b (bottom, white) transcripts labeled using RNAscope, with counterstaining using DAPI (blue). (D) Enlargement of boxes at 28 hpf show the fluorescent signal (left) of the Hcrt neurons and colocalized cxcl12a (top) and cxcr4b (bottom) transcripts and the Imaris “Spots” labeling (right) of these transcripts within Hcrt neurons using Imaris software for quantification. Scale bar low magnification 20 µm; high magnification 8 µm. aAH anterior part of the anterior hypothalamus, pAH posterior part of the anterior hypothalamus, ORR optic recess region, Tel telencephalon, Hcrt hypocretin, hpf hours post fertilization. |