
Figure 4
- ID
- ZDB-FIG-230131-57
- Publication
- Collier et al., 2023 - Neuronal chemokine concentration gradients mediate effects of embryonic ethanol exposure on ectopic hypocretin/orexin neurons and behavior in zebrafish
- Other Figures
- All Figure Page
- Back to All Figure Page
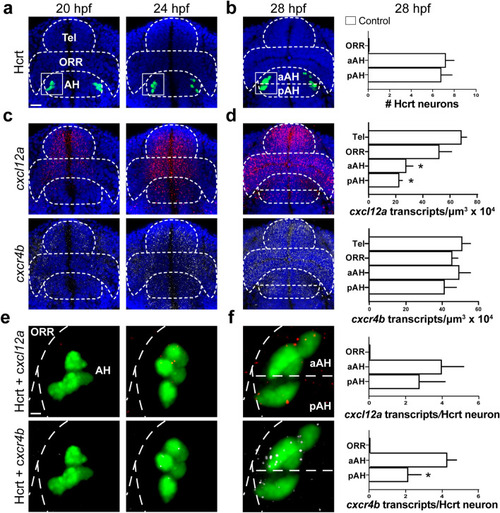
Embryonic development of Hcrt neurons and cxcl12a and cxcr4b transcripts under control conditions in 20, 24 and 28 hpf zebrafish brains, as evidenced by RNAscope. (a) Representative photomicrographs (×25) illustrate the zebrafish brain in a dorsal/ventral view with the AH, aAH, pAH, ORR and Tel of the brain outlined by dashed lines, the Hcrt neurons (green) tightly clustered together at 20 hpf while starting to spread out and increase in number at 24 hpf, and the cells counterstained with DAPI (blue). (b) Representative photomicrographs show Hcrt neurons (green) at 28 hpf that have migrated further anterior and become evenly distributed throughout the posterior (pAH) and anterior (aAH) parts of the AH, as shown in the bar graphs (n = 6). (c) Representative photomicrographs show the density of cxcl12a transcripts (red, top) and cxcr4b transcripts (white, bottom) naturally increases from 20 to 24 hpf, and the cxcl12a transcripts show a tendency to be highest in the anterior part of the brain, while the cxcr4b transcripts appear evenly distributed throughout all brain areas. (d) Representative photomicrographs show the cxcl12a transcripts (top) at 28 hpf as they become more dense and exhibit a natural posterior-to-anterior concentration gradient throughout the brain, with lowest levels in the pAH, moderate levels in the aAH and ORR, and highest levels in the Tel, as shown in the bar graph (n = 6). The density of cxcr4b transcripts (bottom), in contrast, is uniform across all brain regions, as shown in the bar graph (n = 6). (e) Enlargements of boxes at 20 hpf show no co-localization with cxcl12a (top) or cxcr4b (bottom) transcripts, while some co-localization is evident at 24 hpf. (f) Enlargement of boxes at 28 hpf show the cxcl12a and cxcr4b transcripts to exhibit high levels of co-localization with Hcrt neurons, with these colocalized transcripts showing dim expression. While the number of cxcl12a transcripts (top) are equally expressed in Hcrt neurons of the aAH and pAH, there is a significantly greater number of cxcr4b transcripts (bottom) in Hcrt neurons in the aAH compared to the pAH as shown in the bar graph (n = 6). Scale bar low magnification 20 µm; high magnification 8 µm. *p < 0.05 compared to Tel. Results are shown as means ± standard errors. AH anterior hypothalamus, aAH anterior part of the anterior hypothalamus, pAH posterior part of the anterior hypothalamus, ORR optic recess region, Tel telencephalon, Hcrt hypocretin, hpf hours post fertilization. |