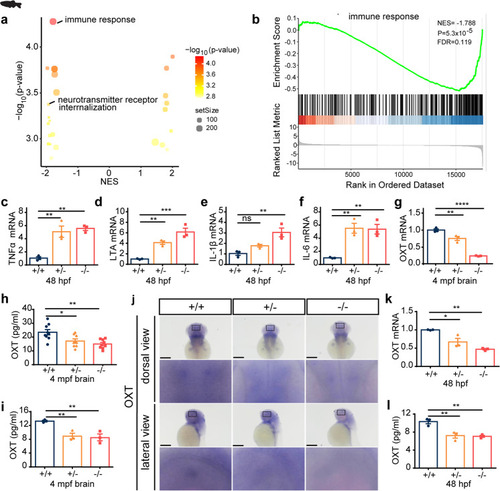
Scgn deficiency impairs immune response and decrease oxytocin secretion in zebrafish. a Volcano plots of GSEA results based on differentially expressed genes in the brains of 4 month old of scgn+/+ and scgn−/− zebrafish. The dot color indicated the −log10 p-value in each pathway, while the dot size represented the gene number of each pathway. b GSEA plot showed the signatures of the immune response in transcriptomes in scgn+/+ and scgn−/− zebrafish brains. NES Normalized Enrichment Score. P p-value. FDR False Discovery Rate. c–f Relative mRNA expression of immune and inflammation related genes upon scgn+/+ and scgn−/− zebrafish. c TNFα; d LTA; e IL-1β; f IL-6. N = 3 for each group. +/+: scgn+/+, +/−: scgn+/−, −/−: scgn−/−. Data were presented as mean ± SD, P-values were calculated using one-way ANOVA, Tukey’s multiple comparisons test. ***p < 0.001, **p < 0.01, *p < 0.05, ns not significant. g Relative mRNA expression of oxytocin in adult fish brain. N = 3 for each group. Data were presented as mean ± SD, P-values were calculated using one-way ANOVA, Tukey’s multiple comparisons test. ****p < 0.0001, **p < 0.01. h Scgn−/− and scgn+/− had lower brain oxytocin concentrations than scgn+/+. +/+: scgn+/+, +/−: scgn+/−, −/−: scgn−/−. N = 3 for each group. Data were presented as mean ± SD, P-values were calculated using one-way ANOVA, Tukey’s multiple comparisons test. **p < 0.01, *p < 0.05. g Relative mRNA expression of oxytocin in adult fish brain. N = 3 for each group. Data were presented as mean ± SD, P-values were calculated using one-way ANOVA, Tukey’s multiple comparisons test. ****p < 0.0001, **p < 0.01. i Scgn−/− and scgn+/− had lower plasma oxytocin concentrations than scgn+/+. Data were presented as mean ± SD, P-values were calculated using one-way ANOVA, Tukey’s multiple comparisons test. **p < 0.01. N = 3. j Whole-mount in situ hybridization in dorsal view (Top) and lateral view (Down) of oxytocin in 48 hpf zebrafish embryos upon scgn+/+, scgn+/−, and scgn−/−. The black rectangles label the position of oxytocin+ cells. Scale bar: 120 μm. k QRT-PCR analysis of the relative transcription level of oxytocin at 48 hpf upon 3 groups. N = 3 for each group. Data were presented as mean ± SD, P-values were calculated using one-way ANOVA, Tukey’s multiple comparisons test. **p < 0.01, *p < 0.05. l Oxytocin concentration levels in 48 hpf upon scgn+/+, scgn+/−, and scgn−/−. Data were presented as mean ± SD, P-values were calculated using one-way ANOVA, Tukey’s multiple comparisons test. **p < 0.01
|
