|
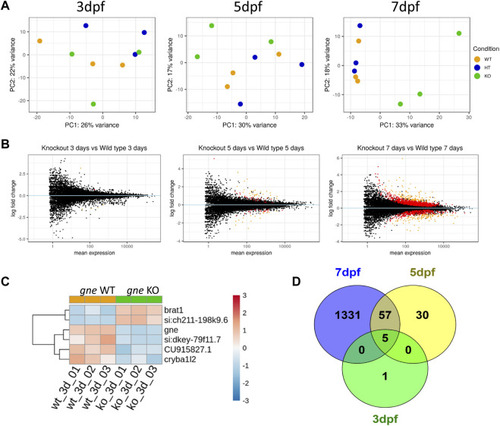
Transcriptomics analysis of gne KO larvae. (A) PCA plots of gne KO vs. gne WT at 3 dpf, 5 dpf and 7 dpf. gne KO cluster separates from gne WT and gne HT from 5 dpf onwards. (B) MA plots of gne KO vs. gne WT at 3, 5 and 7 dpf. Red and orange dots refer to significant differentially expressed genes, black dots are for non-significant genes. (C) Hierarchical classification of DE genes in gne WT versus gne KO at 3 dpf (3 biological replicates). The figure presents upregulated (red) and downregulated (blue) genes. (CU915827.1 = si:dkey 31e10.5). (D) Venn diagram indicating the number of significant differentially expressed genes among gne KO and gne WT siblings at 3 (green), 5 (yellow) and 7 (blue) dpf.
|