
FIGURE
FIGURE 11
FIGURE 11
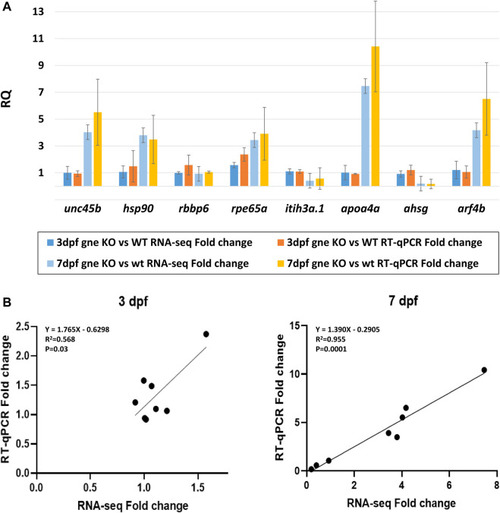
Validation of the transcriptomic data. (A) Comparison of the fold-change values between RNA-sequencing and RT-qPCR data for 8 chosen DE genes shows consistency at 3 dpf and 7 dpf samples (20 embryos/sample, 2 biological replicates). Y axis represents the mean RQ values, standard deviations are presented. (B) Gene expression correlation between RT-qPCR and RNA-seq fold-change at 3 dpf and 7 dpf. Linear regression equations, R2 and p values are presented (Pearson’s correlation analysis). |
Expression Data
Expression Detail
Antibody Labeling
Phenotype Data
Phenotype Detail
Acknowledgments
This image is the copyrighted work of the attributed author or publisher, and
ZFIN has permission only to display this image to its users.
Additional permissions should be obtained from the applicable author or publisher of the image.
Full text @ Front Cell Dev Biol