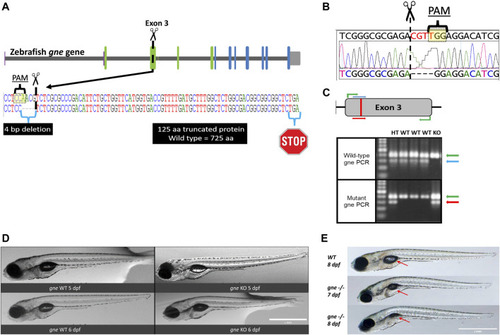
Generation and development of the gne knockout zebrafish. (A) Schematic representation of CRISPR/Cas9 mutagenesis in the zebrafish gne gene, exon 3. A diagram of the gne gene containing 12 exons, represented by green (epimerase domain) and blue (kinase domain) rectangles, and the UTRs. The PAM sequence is specified, position of the generated 4 bp deletion site is indicated by scissors symbol and the putative premature termination codon is depicted by a stop symbol. (B) Sanger sequencing chromatogram of gne KO larvae (bottom sequence) indicating a 4 bp deletion in gne exon 3. The PAM sequence and the double-strand break position (scissors) are indicated. (C) Zebrafish gne alleles PCR genotyping. The top panel represents a schematic view of the primers’ position in each PCR reaction. Wild-type specific PCR is presented on the top gel, and mutant specific on the bottom gel. Green arrows represent a 399 bp amplicon of exon 3. Blue arrows represent a 300 bp wild-type (WT) specific amplicon, red arrows represent the mutant (KO) specific amplicon. Heterozygotes (HT) show both allele-specific amplicons. 100 bp DNA marker was loaded on the left lanes of each 1.5% agarose gel. (D) Zebrafish gne KO larvae exhibit a normal phenotype at 5 and 6 dpf. gne genotype and age are indicated at the bottom of each image. Scale bar = 1 mm. (E) Zebrafish gne KO phenotype. Zebrafish gne KO larvae present deflation of the swim bladder and progressive curving of the body at 7 and 8 dpf, compared to WT zebrafish at 8 dpf. Red arrows indicate the swim bladder. Scale bar = 1 mm.
|
