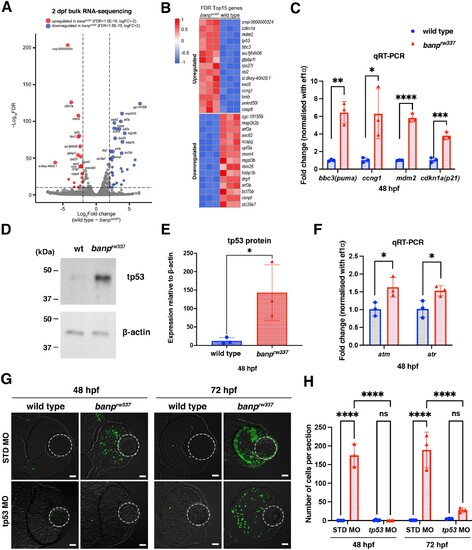
(A) A volcano plot indicating gene differential expression of 48 hpf wild-type versus banprw337 mutant embryos. Red dots show genes that were upregulated ≥2 fold in mutants, while blue dots represent genes downregulated ≥2 fold. (B) Heat map of the top 15 differentially expressed genes. (C) Relative mRNA expression levels for bbc3, ccng1, mdm2, cdkn1a in wild type and banprw337 mutants. Quantitative RT-PCR confirmed the up-regulation of p53 pathway genes in banprw337 mutants at 48 hpf. Unpaired t-test (two-tailed), Mean ± SD. [n=3, p*<0.05, p**<0.01, p***<0.001, p****<0.0001]. (D) Western blotting of wild-type and banprw337 mutants with anti-tp53 antibody. Full-length tp53 protein is stabilized in banprw337 mutants, compared to wild type. β-actin protein is an endogenous control and used for normalization of tp53 protein level. (E) Quantification of tp53 protein level relative to a control protein, β-actin, in wild-type and banprw337 mutants. The tp53 protein level is significantly higher in banprw337 mutants than in wild type at 48 hpf. Unpaired t-test (two-tailed), Mean ± SD. [n=3, p*<0.05]. (F) Relative mRNA expression levels for atm and atr in wild type and banprw337 mutants. Both mRNAs are significantly up-regulated in banprw337 mutants at 48 hpf. Unpaired t-test (two-tailed) [n=3, p*<0.05]. (G) TUNEL of wild-type and banprw337 mutant retinas injected with STD MO and tp53 MO at 48 hpf and 72 hpf. Scale bars: 20 μm. (H) Histogram of the number of TUNEL-positive cells per retinal section in wild-type and banprw337 mutant retinas injected with STD MO and tp53 MO at 48 hpf and 72 hpf. Two-way ANOVA, Tukey’s multiple comparisons test, Mean ± SD. [n=3 for STD-MO at 48 hpf and tp53-MO at 72 hpf; n=4 for tp53-MO at 48 hpf and STD-MO at 72 hpf, p****<0.0001].