
Fig. 3
- ID
- ZDB-FIG-220804-14
- Publication
- Chang et al., 2022 - Zebrafish transposable elements show extensive diversification in age, genomic distribution, and developmental expression
- Other Figures
- All Figure Page
- Back to All Figure Page
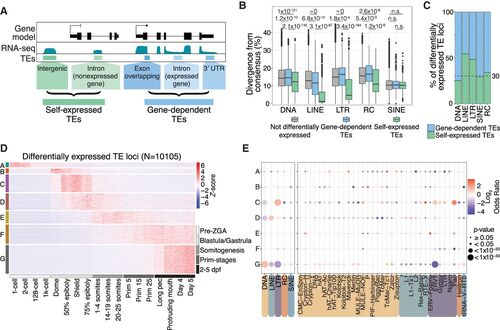
TEs are expressed in stage-specific patterns during zebrafish development. (A) Schematic representation of self-expression or gene-dependent expression of TE loci. (B) TEs that are both differentially expressed and self-expressed are younger, with lower divergence from consensus, compared with differentially expressed gene-dependent TEs and nondifferentially expressed TEs (to see the divergence from consensus for all TE categories shown in A, see Supplemental Fig. 5A). P-values were calculated using Wilcoxon rank-sum tests. (C) Fraction of differentially expressed gene-dependent or self-expressed TE loci, split by TE class (for split by TE family, see Supplemental Fig. 5C). (D) Z-score from whole-embryo RNA-seq data (White et al. 2017) shows a subset of differentially self-expressed TE loci displaying stage-specific expression. Clusters are derived using k-means clustering. (E) TE class-specific (left) and superfamily-specific (right) enrichment analysis per expression cluster in D. Only TE superfamilies with significant enrichment are shown. Gray dots indicate not significant. dpf: days post fertilization. |