- Title
-
Zebrafish transposable elements show extensive diversification in age, genomic distribution, and developmental expression
- Authors
- Chang, N.C., Rovira, Q., Wells, J.N., Feschotte, C., Vaquerizas, J.M.
- Source
- Full text @ Genome Res.
|
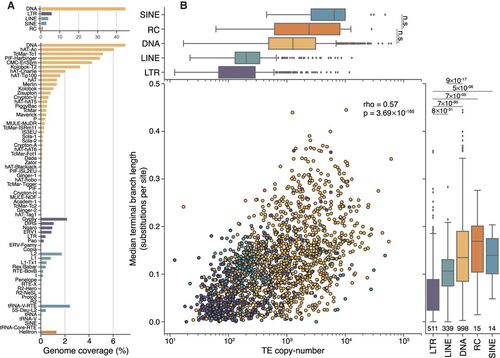
Genome proportions, copy number, and median age differ between TE classes. (A) DNA transposons, including rolling-circle elements (Helitrons), take up approximately four times more genomic space than retroelements and contain a greater number of distinct superfamilies. (B) Overall, there is a moderate correlation between the copy number of TE families and their median age (Spearman's ρ = 0.57, P = 3.69 × 10−165). LTR elements, on average, are younger than other classes (lower values on the y-axis), and DNA transposons are typically older. Numbers underneath the box plots are the number of distinct TE families used in this analysis. Significance was calculated using Wilcoxon rank-sum tests between each TE class, using a Bonferroni-corrected P-value threshold of 0.001 for determining significance. For clarity, only the two nonsignificant tests are shown in the top panel. |
|
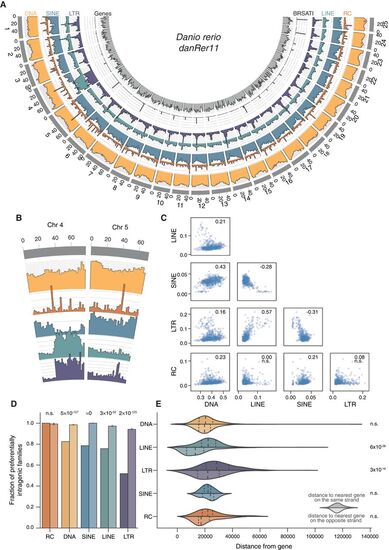
Genomic distribution of elements is nonrandom. (A) Genomic coverage of TEs in nonoverlapping 2-Mbp windows across nuclear chromosomes. Each axis line (faint gray) represents 2.5% sequence coverage. (B) Detail on Chromosomes 4 and 5. (C) Spearman's rank correlations of coverage density between major TE classes. Values for ρ given in top right corner of each plot; (n.s.) not significant. (D) TE families are defined as “preferentially intragenic” if the median distance between their insertions and the closest gene is zero; that is, most insertions in the family overlap partially or fully with gene bodies. Bars for each TE class represent observed fractions (left bars) and fractions based on random shuffling of TE insertion identities across the genome, keeping locations fixed (right bars, color desaturated). P-values calculated using binomial tests. (E) Median, per family, distance of insertions from nearest genes. Top halves indicate distance from closest gene on same strand; bottom halves (desaturated), distance from closest gene on opposite strand. P-values calculated using Wilcoxon rank-sum tests. |
|
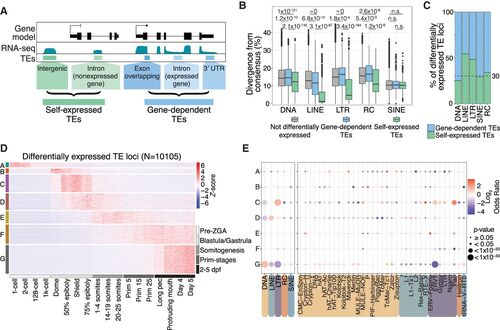
TEs are expressed in stage-specific patterns during zebrafish development. (A) Schematic representation of self-expression or gene-dependent expression of TE loci. (B) TEs that are both differentially expressed and self-expressed are younger, with lower divergence from consensus, compared with differentially expressed gene-dependent TEs and nondifferentially expressed TEs (to see the divergence from consensus for all TE categories shown in A, see Supplemental Fig. 5A). P-values were calculated using Wilcoxon rank-sum tests. (C) Fraction of differentially expressed gene-dependent or self-expressed TE loci, split by TE class (for split by TE family, see Supplemental Fig. 5C). (D) Z-score from whole-embryo RNA-seq data (White et al. 2017) shows a subset of differentially self-expressed TE loci displaying stage-specific expression. Clusters are derived using k-means clustering. (E) TE class-specific (left) and superfamily-specific (right) enrichment analysis per expression cluster in D. Only TE superfamilies with significant enrichment are shown. Gray dots indicate not significant. dpf: days post fertilization. |
|
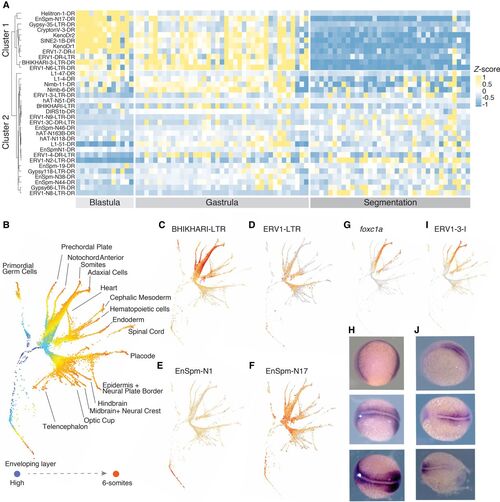
TE families with cell lineage–specific expression across development stages. (A) Heatmap of differentially expressed TE families between cell clusters across developmental stages. Hierarchical clustering shows two groups of TE families with distinct expression patterns: one group with early expression in the blastula and gastrula stages and one group with later expression in the gastrula and segmentation stages. TE classes are equally represented in both groups. (B) Pseudotime tree across 12 development stages based on both gene and TE expression. (C–F) TE families with expression patterns in different cell lineages: (C) BHIKHARI-LTR, (D) ERV1-LTR, (E) EnSpm-N1, (F) EnSpm-N17. (G,H) The expression pattern of foxc1a in a pseudotime tree (G) and in 11 hpf embryos by in situ hybridization (H). (I,J) The expression pattern of ERV1-3-I in the pseudotime tree (I) and in 11 hpf embryos by in situ hybridization (J). hpf: hours post fertilization. |


