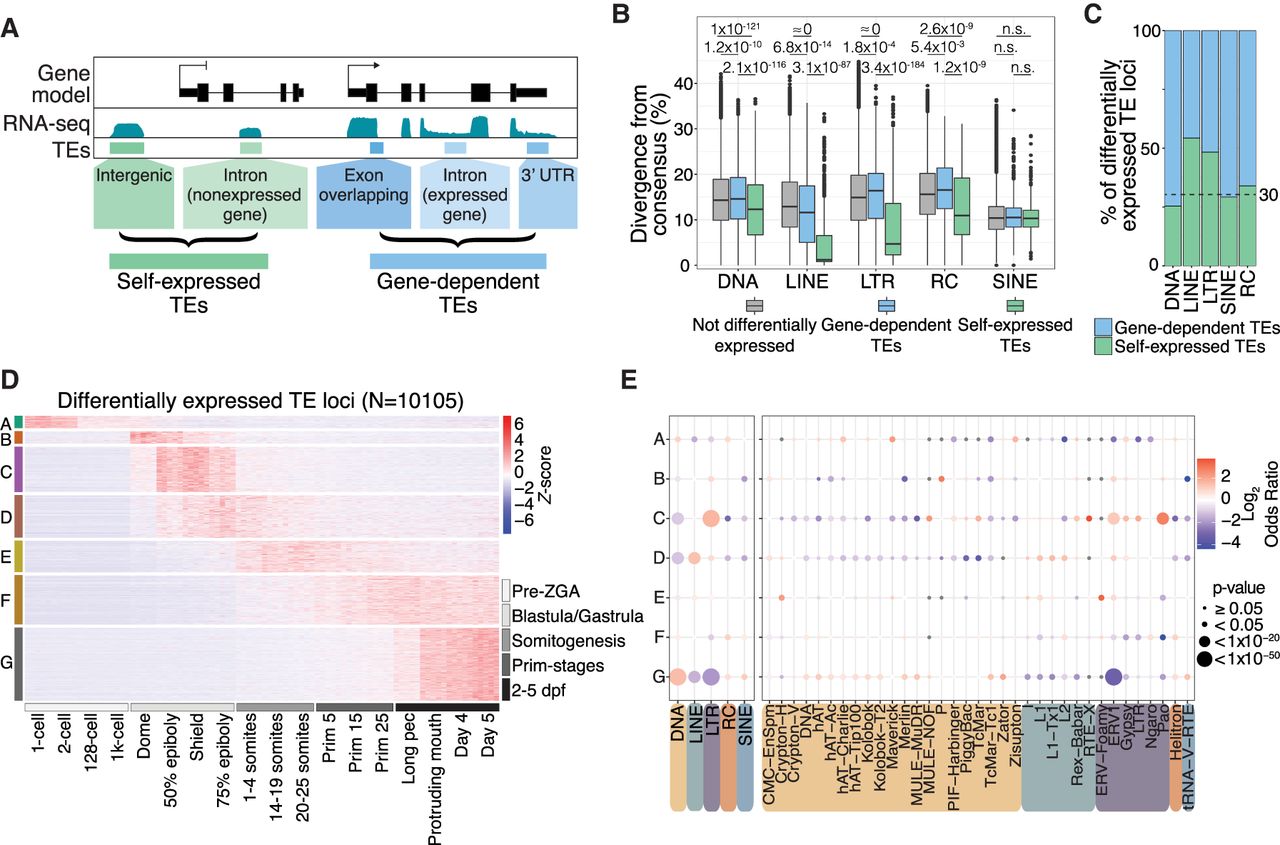
Fig. 3 TEs are expressed in stage-specific patterns during zebrafish development. (A) Schematic representation of self-expression or gene-dependent expression of TE loci. (B) TEs that are both differentially expressed and self-expressed are younger, with lower divergence from consensus, compared with differentially expressed gene-dependent TEs and nondifferentially expressed TEs (to see the divergence from consensus for all TE categories shown in A, see Supplemental Fig. 5A). P-values were calculated using Wilcoxon rank-sum tests. (C) Fraction of differentially expressed gene-dependent or self-expressed TE loci, split by TE class (for split by TE family, see Supplemental Fig. 5C). (D) Z-score from whole-embryo RNA-seq data (White et al. 2017) shows a subset of differentially self-expressed TE loci displaying stage-specific expression. Clusters are derived using k-means clustering. (E) TE class-specific (left) and superfamily-specific (right) enrichment analysis per expression cluster in D. Only TE superfamilies with significant enrichment are shown. Gray dots indicate not significant. dpf: days post fertilization.
Image
Figure Caption
Acknowledgments
This image is the copyrighted work of the attributed author or publisher, and
ZFIN has permission only to display this image to its users.
Additional permissions should be obtained from the applicable author or publisher of the image.
Full text @ Genome Res.

