Fig. 4
- ID
- ZDB-FIG-220804-15
- Publication
- Chang et al., 2022 - Zebrafish transposable elements show extensive diversification in age, genomic distribution, and developmental expression
- Other Figures
- All Figure Page
- Back to All Figure Page
|
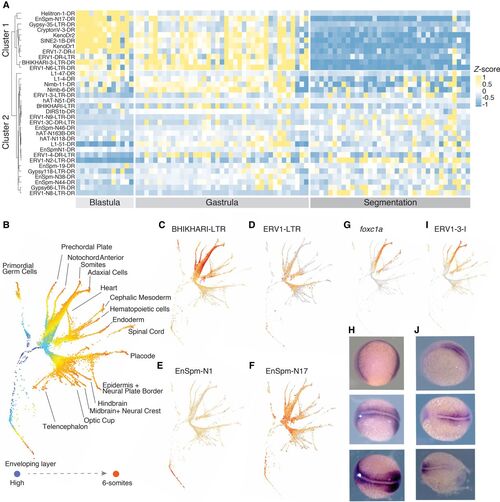
TE families with cell lineage–specific expression across development stages. (A) Heatmap of differentially expressed TE families between cell clusters across developmental stages. Hierarchical clustering shows two groups of TE families with distinct expression patterns: one group with early expression in the blastula and gastrula stages and one group with later expression in the gastrula and segmentation stages. TE classes are equally represented in both groups. (B) Pseudotime tree across 12 development stages based on both gene and TE expression. (C–F) TE families with expression patterns in different cell lineages: (C) BHIKHARI-LTR, (D) ERV1-LTR, (E) EnSpm-N1, (F) EnSpm-N17. (G,H) The expression pattern of foxc1a in a pseudotime tree (G) and in 11 hpf embryos by in situ hybridization (H). (I,J) The expression pattern of ERV1-3-I in the pseudotime tree (I) and in 11 hpf embryos by in situ hybridization (J). hpf: hours post fertilization. |

