
FIGURE
Fig. 6
- ID
- ZDB-FIG-220623-68
- Publication
- Silvennoinen et al., 2022 - SCN1A overexpression, associated with a genomic region marked by a risk variant for a common epilepsy, raises seizure susceptibility
- Other Figures
- All Figure Page
- Back to All Figure Page
Fig. 6
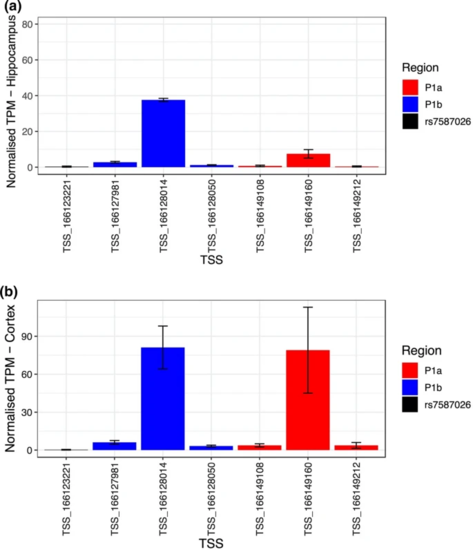
Normalized tags per million (TPM) expression values of the TSSs located upstream of SCN1A in the hippocampus (a) and cortex (b). In red are shown the TSSs located in P1a, in blue the TSSs in P1b and in black the TSS close to rs7587026. The black bars indicate the standard error (SE) of the mean |
Expression Data
Expression Detail
Antibody Labeling
Phenotype Data
Phenotype Detail
Acknowledgments
This image is the copyrighted work of the attributed author or publisher, and
ZFIN has permission only to display this image to its users.
Additional permissions should be obtained from the applicable author or publisher of the image.
Full text @ Acta Neuropathol.