
Fig. 2
- ID
- ZDB-FIG-220623-64
- Publication
- Silvennoinen et al., 2022 - SCN1A overexpression, associated with a genomic region marked by a risk variant for a common epilepsy, raises seizure susceptibility
- Other Figures
- All Figure Page
- Back to All Figure Page
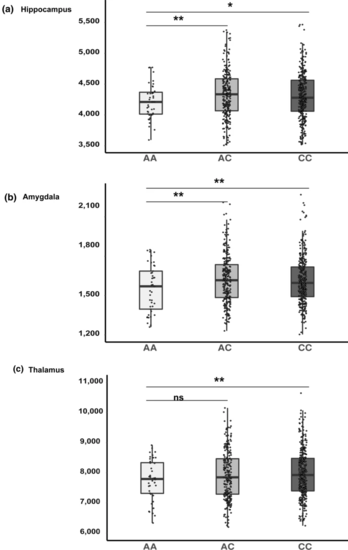
Subcortical volumes by genotype. The mean volumes of the a hippocampus, b amygdala and c thalamus are presented based on rs7587026 genotype in healthy young individuals. The mean volume was calculated from left and right hemisphere structural volumes in mm3. In each figure, the x-axis displays three groups of the QTIM sample based on rs7587026 genotype: minor allele homozygotes (AA; n = 41), minor allele heterozygotes (AC; n = 242), and major allele homozygotes (CC; n = 314). The y-axis displays the structural volume in mm3. Error bars represent standard error (SE) of the means. *P < 0.05; **P < 0.01; ns non-significant |