
Image
|
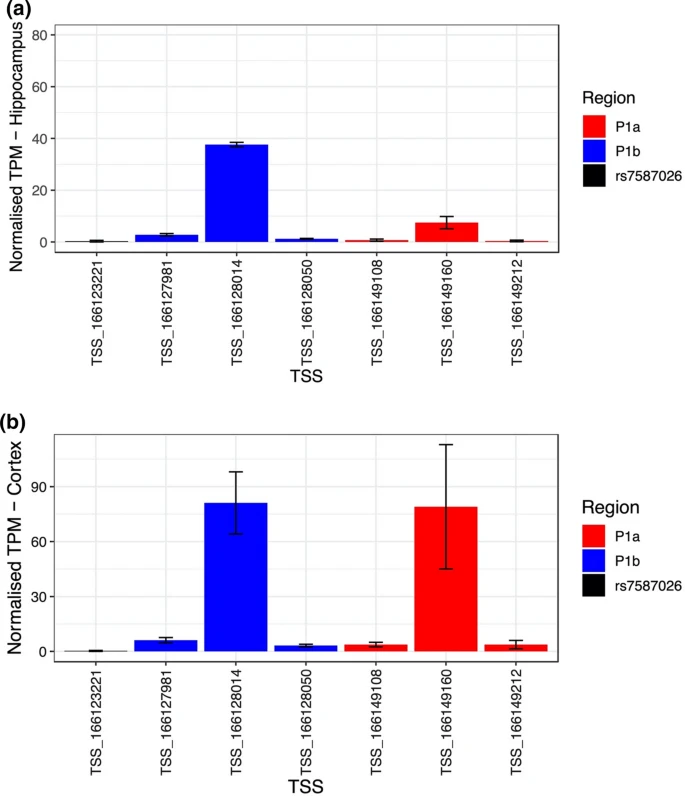
Figure Caption
Fig. 6
Normalized tags per million (TPM) expression values of the TSSs located upstream of SCN1A in the hippocampus (a) and cortex (b). In red are shown the TSSs located in P1a, in blue the TSSs in P1b and in black the TSS close to rs7587026. The black bars indicate the standard error (SE) of the mean
Acknowledgments
This image is the copyrighted work of the attributed author or publisher, and
ZFIN has permission only to display this image to its users.
Additional permissions should be obtained from the applicable author or publisher of the image.
Full text @ Acta Neuropathol.