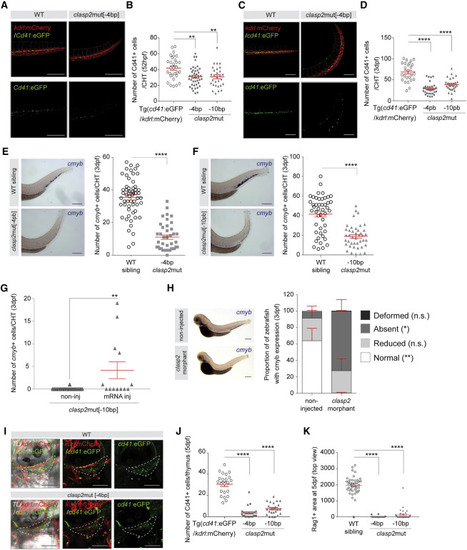
Figure 3. CLASP2 is required to maintain HSPC activity throughout zebrafish development (A) Representative merge (top panels) and single GFP fluorescence (bottom panels) images of Tg(cd41:eGFP/kdrl:mCherry) (WT) and clasp2mut[−4bp] zebrafish CHTs (background Tg(cd41:eGFP/kdrl:mCherry)) at 52 hpf (n = 3). (B) Number of Cd41+ cells in the CHT of WT, clasp2mut[−4bp] and clasp2mut[−10bp] zebrafish embryos at 52 hpf (n = 4–5; 30 WT, 41 clasp2mut[−4bp], 29 clasp2mut[−10bp] embryos). (C) Representative merge (top panels) and single GFP fluorescence (bottom panels) images of Tg(cd41:eGFP/kdrl:mCherry) and clasp2mut[−4bp] zebrafish CHTs at 3 dpf (n = 3). (D) Number of Cd41+ cells in the CHT of WT, clasp2mut[−4bp], and clasp2mut[−10bp] zebrafish embryos at 3 dpf (n = 4; 25 WT, 32 clasp2mut[−4bp], 27 clasp2mut[−10bp]). (E and F) Representative WISHs and graphs showing the number of cmyb+ cells in the CHT of WT sibling, clasp2mut[−4bp] (E) and clasp2mut[−10bp] (F) embryos at 3 dpf (n = 4, with a total of 57 WT [sibling], 40 clasp2mut[−4bp], 46 WT [sibling], and 42 clasp2mut[−10bp] embryos). Representative images of WISH for cmyb expression are shown on the left. (G) Number of cmyb+ cells per CHT of clasp2mut[−10bp] embryos non-injected (non-inj) or injected (inj) with WT clasp2 mRNA for rescue and analyzed at 3dpf. (H) Proportion of zebrafish embryos with normal or reduced presence or absence of cmyb expression in the CHT or deformity at 3 dpf after no injection or injection of clasp2 morpholinos. Representative cases of WISH for cmyb expression are shown on the left. n = 5 with a total of 155 non-inj and 239 inj embryos. (I) Representative merge (left panels), double (center panels), and single GFP (right panels) fluorescence images of Tg(cd41:eGFP/kdrl:mCherry) (WT) and clasp2mut[−4bp] (background Tg(cd41:eGFP/kdrl:mCherry)) zebrafish thymi (dashed area) at 5 dpf. (J) Number of Cd41+ cells in the thymus (dashed areas shown in I) of WT, clasp2mut[−4bp] and clasp2mut[−10bp] embryos at 5 dpf (n = 3; 22 WT, 25 clasp2mut[−4bp], 23 clasp2mut[−10bp]). (K) Rag1+ area (arbitrary unit) from the top view of the thymus (sum of both thymi) at 5 dpf in WT sibling, clasp2mut[−4bp], and clasp2mut[−10bp] embryos (n = 2; 42 WT, 20 clasp2mut[−4bp], 39 clasp2mut[−10bp]). Green, GFP; ted, mCherry (A, C, and I). Mean ± SEM (B, D–H, J, and K). ∗∗∗∗p < 0.0001, ∗∗p < 0.01, ∗p < 0.05, Mann-Whitney U test (B, D–H, J, and K). Scale bars, 200 μm (A and C) and 100 μm (I). CHT, caudal hematopoietic tissue. dpf, day post fertilization. See also Figures S4 and S5.
|
