
Fig. 5
- ID
- ZDB-FIG-220617-24
- Publication
- Klaus et al., 2022 - CLASP2 safeguards hematopoietic stem cell properties during mouse and fish development
- Other Figures
- All Figure Page
- Back to All Figure Page
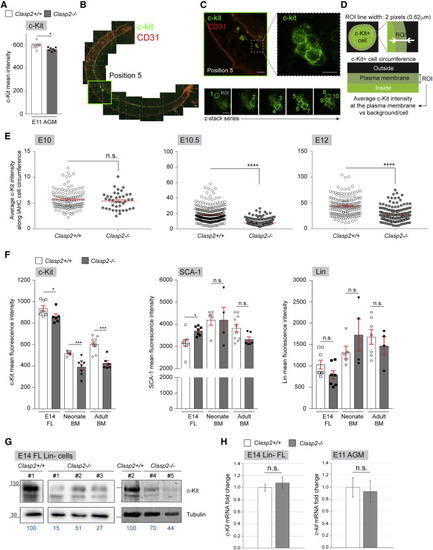
Figure 5. Progressive loss of c-Kit at the plasma membrane of Clasp2−/− cells throughout development (A) MFI of c-Kit measured by flow cytometry in E11 Clasp2+/+ and Clasp2−/− AGMs (9 Clasp2+/+, 7 Clasp2−/−, n = 7). (B) Tile-scale image reconstruction of a whole E10.5 Clasp2+/+ embryo stained with c-Kit (green) and CD31 (red) antibodies. (C) Enlarged image of position 5 shown in (B), with a dashed box outlining the inset, which is shown enlarged on the right and reveals c-Kit fluorescence (green) in an IAHC. Bottom panels: images of this IAHC in various focal planes to draw regions of interest (ROIs) at the maximal fluorescence intensity along the circumference of IAHC cells through a z stack series. (D) Illustration of a IAHC cell with the ROI (2 pixels in width) to measure the average c-Kit fluorescence intensity. (E) Average MFI of c-Kit along the plasma membrane circumference of IAHC cells in the aortae of E10, E10.5, and E12 Clasp2+/+ and Clasp2−/− embryos after whole-mount immunostaining with c-Kit antibody (E10: 1 Clasp2+/+, 2 Clasp2−/−; E10.5: 1 Clasp2+/+, 1 Clasp2−/−; E12: 1 Clasp2+/+, 1 Clasp2−/−). (F) MFI of c-Kit, SCA-1, and Lin markers, measured by flow cytometry in E14 FL and neonate and adult BM cells isolated from Clasp2+/+ and Clasp2−/− embryos and mice (E14 FLs [8 Clasp2+/+, 6 Clasp2−/− embryos], n = 3; P8 BM [6 Clasp2+/+, 8 Clasp2−/−], n = 6; adult BM [10 Clasp2+/+, 6 Clasp2−/−], n = 7). (G) WBs for c-Kit and tubulin (loading control) on lysates of E14 Clasp2+/+ and Clasp2−/− Lin− FL cells (2 Clasp2+/+, 5 Clasp2−/−, n = 2). c-Kit intensity is indicated in blue below the gel images; the Clasp2+/+ culture band was set at 100. (H) qRT-PCR for c-Kit on Lin− FL cells and total AGM cells from Clasp2+/+ and Clasp2−/− embryos isolated at E14 and E11, respectively. Error bars: mean ± SEM (A, E, and F), mean ± SD (H). ∗∗∗∗p < 0.0001, ∗∗∗p < 0.001, ∗p < 0.05, Mann-Whitney U test (A, E, and F), unpaired t test (H). Scale bars, 100 μm (B and C) and 10 μm (C, close up). |