
Fig. 4
- ID
- ZDB-FIG-220617-23
- Publication
- Klaus et al., 2022 - CLASP2 safeguards hematopoietic stem cell properties during mouse and fish development
- Other Figures
- All Figure Page
- Back to All Figure Page
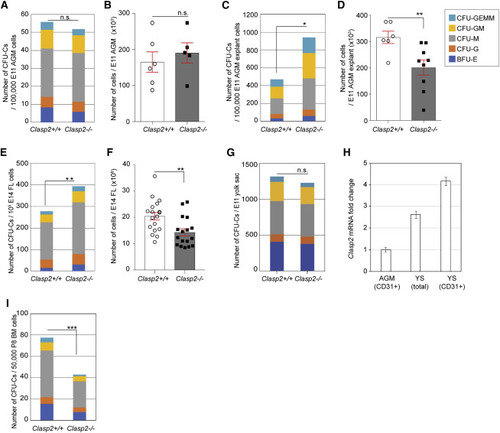
Figure 4. Premature hematopoietic differentiation in Clasp2−/− embryos compared with Clasp2+/+ embryos (A) Number of CFU-Cs per 100,000 AGM cells of E11 Clasp2+/+ and Clasp2−/− embryos. (B) Number of total cells per E11 AGM of Clasp2+/+ and Clasp2−/− embryos at day 0. (C) Number of CFU-Cs per 100,000 E11 AGM cells obtained after 3 days of explant culture. (D) Number of total cells per E11 AGM after explant culture. (E) Number of CFU-Cs per 105 E14 FL cells. (F) Number of total cells per E14 FLs. (G) Number of CFU-Cs per 1 ee of E11 YS cells. (H) Fold change of clasp2 (alpha) mRNA in total cells and sorted CD31+ endothelial cells from E11 WT YSs compared with sorted CD31+ endothelial cells from E11 WT AGMs (value set at 1) after qRT-PCR. (I) Number of CFU-Cs per 50,000 BM cells obtained from P8 neonates. For E11 AGM at day 0, n = 3 [10 Clasp2+/+, 12 Clasp2−/−]; E11 AGM explant, n = 5 [12 Clasp2+/+, 16 Clasp2−/−]; E14 FL, n = 3 [3 Clasp2+/+, 4 Clasp2−/−]; E11 YS, n = 3 [10 Clasp2+/+ and 12 Clasp2−/−]; P8 BM neonates, n = 2 [2 Clasp2+/+, 2 Clasp2−/−]. Data are represented as mean ± SEM (B, D, and F) and mean ± SE (H). ∗∗∗p < 0.001, ∗∗p < 0.01, ∗p < 0.05, Mann-Whitney U test. CFU-GEMM, colony-forming unit-granulocyte-erythroid-macrophage-megakaryocyte; CFU-GM, CFU-granulocyte-macrophage; CFU-M, CFU-macrophage; CFU-G, CFU-granulocyte; BFU-E, burst-forming unit-erythroid; YS, yolk sac. See also Figure S6. |