IMAGE

FIGURE 3

ID
ZDB-IMAGE-220612-3
Source
Figures for Zhang et al., 2022
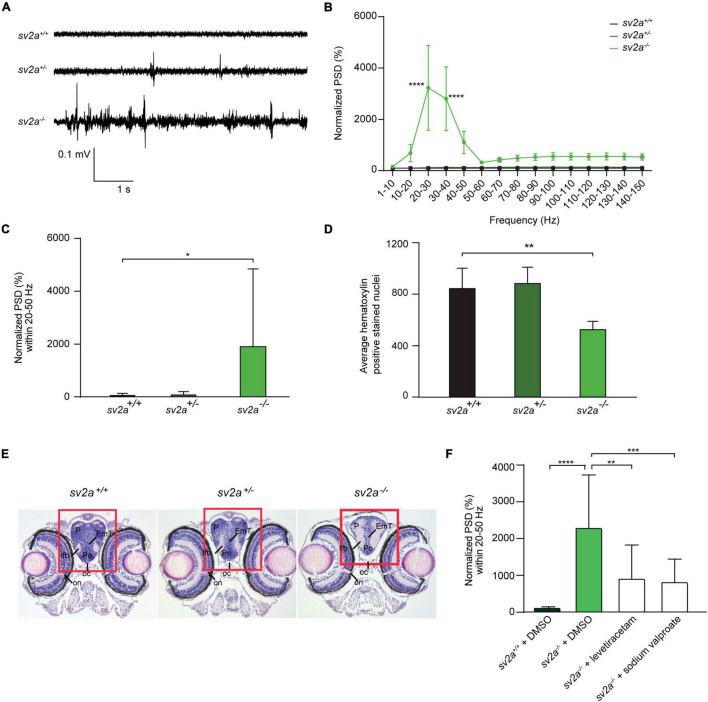
Image
Figure Caption

FIGURE 3

Spontaneous electrographic seizures and brain malformation in sv2a knockout zebrafish. (A) Representative local field potential (LFP) recordings of sv2a+/+, sv2a+/–, and sv2a –/– zebrafish larvae at 6 dpf. (B) Power spectral density (PSD) analysis of sv2a+/+ (n = 9), sv2a+/– (n = 11), and sv2a –/– (n = 10) zebrafish larvae at 6 dpf. A significant increase in PSD values was observed in sv2a–/– larvae compared to sv2a+/+ larvae. Results were normalized to sv2a+/+ larvae as 100%. Statistical analysis was performed using two-way ANOVA with Sidak’s multiple comparisons test (****p < 0.0001 compared to sv2a+/+). (C) PSD values (mean ± SD) plotted per condition over the 20–50 Hz region. Statistical analysis was performed using one-way ANOVA followed by Dunnett’s multiple comparison (*p < 0.05). (D) Hematoxylin-positive stained nuclei (mean ± SD) counted using QuPath (0.1.2) software. The region with significant loss of hematoxylin-positive stained nuclei was highlighted in red. The results are expressed as mean ± SD of 4 equivalent sections per genotype. Statistical analysis was performed using one-way ANOVA followed by Dunnett’s multiple comparison (**p < 0.01). (E) Hematoxylin and eosin staining of paraffin-embedded coronary sections from the forebrain of sv2a+/+, sv2a+/–, and sv2a –/– zebrafish larvae at 6 dpf. Scale bar 100 μm. oc, optic chiasm; on, optic nerve; Po, preoptic region; P, pallium; lfb, lateral forebrain bundle. (F) Effect of levetiracetam and sodium valproate on locomotor behavior and epileptiform brain activity in 6 dpf sv2a–/– zebrafish larvae. PSD values (mean ± SD) from LFP recordings at 6 dpf plotted per condition over the 20-50 Hz region for sv2a+/+ and sv2a–/– larvae after incubation with levetiracetam and valproic acid at their MTC or DMSO control at 5 dpf for 22 h. Number of larvae per condition: n = 9–35. Statistical analysis was performed using ordinary one-way ANOVA. **p < 0.01, ***p < 0.001, ****p < 0.0001.

Figure Data
Acknowledgments
This image is the copyrighted work of the attributed author or publisher, and ZFIN has permission only to display this image to its users. Additional permissions should be obtained from the applicable author or publisher of the image. Full text @ Front. Mol. Neurosci.