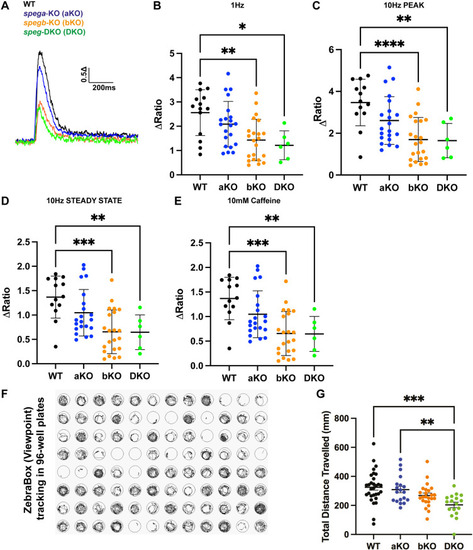
spega/b deficiency in zebrafish disrupts ECC in isolated myofibers and impairs overall muscle performance. (A-E) Cytosolic Ca2+ transients in 7 dpf isolated myofibers were measured using a Ca2+-sensitive dye fluo-4-AM. (A) A representative diagram of Ca2+ transient traces. (B-E) Five-twitch 1 Hz stimulations (B) were followed by one 10 Hz stimulation (C,D) and 30 s of 10 mM caffeine (E). Overall, spegb-KO (bKO) and speg-DKO (DKO) showed significantly reduced ECC compared to WT and spega-KO (aKO). (F) A representative image of swim trace tracking using ZebraBox in a 96-well plate setting, by which total distance traveled (mm) was quantified for each 3 dpf zebrafish per well. (G) Both spegb-KO and speg-DKO swam significantly less distance than WT and spega-KO. All statistical analyses include three independent experiments: for fluo-4-AM experiments (B-E), each dot represents one myofiber, at least n=5 myofibers per group per experiment; for swimming assay (G), each dot represents a 3 dpf zebrafish, at least n=5 zebrafish per group per experiment. Data are mean±s.e.m. One-way ANOVA: *P<0.05; **P<0.01; ***P<0.001; ****P<0.0001. WT, black line or dots; aKO, blue line or dots; bKO, orange line or dots; DKO, green line or dots.
|
