
Fig. 5.
- ID
- ZDB-IMAGE-220521-6
- Publication
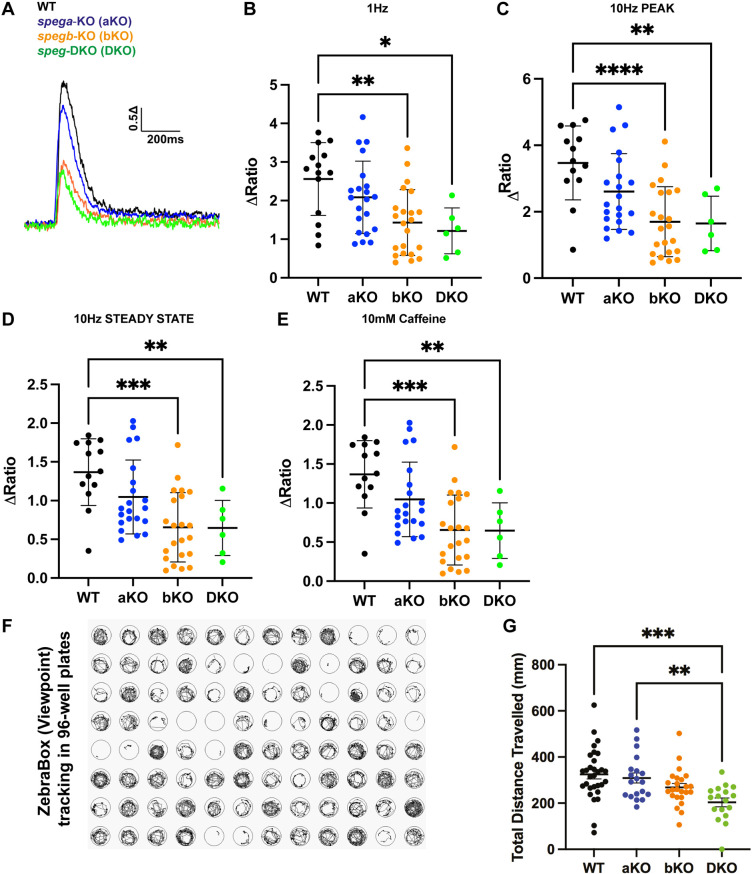
- Espinosa et al., 2022 - Characterization of a novel zebrafish model of SPEG-related centronuclear myopathy
- All Figures
- Figures for Espinosa et al., 2022
|
Fig. 5.