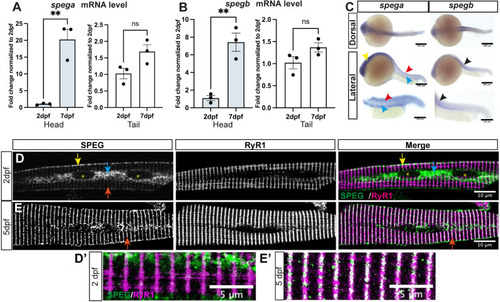
Speg expression during zebrafish development. There are two Speg genes in zebrafish, spega and spegb. Each encodes a single transcript that is highly conserved with human SPEG. (A,B) RT-qPCR shows similar temporal expression patterns of spega (A) versus spegb (B) from 2 days post-fertilization (dpf) to 7 dpf. Both Speg mRNA transcripts are significantly upregulated in the heads (light blue bars; 20-fold for spega, 7-fold for spegb), but stay at relatively similar levels in the skeletal-muscle-predominant tails (white bars). Each data point represents the average of technical triplicates, and three independent experiments are included. Columns and error bars represent mean±s.e.m. Unpaired two-tailed Student's t-test was performed: **P<0.01; ns, not significant. (C) Whole-mount in situ hybridization using DIG-conjugated RNA probes in 1 dpf embryos shows distinct spatial expression patterns of spega versus spegb. spega is predominantly expressed in the developing brain (yellow arrowhead) and along the neural tube (red arrowheads), but absent from the notochord (cyan arrowheads). spegb staining, however, is predominantly detected at the chevron-shaped developing somites (black arrowheads). Scale bars: 200 µm (top and middle rows) or 100 µm (bottom row). (D,E) Confocal images showing 2 dpf (D) or 5 dpf (E) isolated wild-type (WT) skeletal myofibers double-stained with anti-RyR1 (34C, DSHB) and anti-SPEG (PA553875, Invitrogen). (D,D′) At 2 dpf, SPEG is predominantly localized at the sarcolemma (yellow arrows) and perinuclear regions (cyan arrows; nucleus, yellow asterisks), with weak expression in transverse striations (red arrow), whereas RyR1 is localized in transverse striations labeling the terminal SR. Little colocalization (white in Merge) of SPEG (green) and RyR1 (magenta) can be observed at this stage. (E,E′) At 5 dpf, SPEG expression becomes restricted in the transverse striations (red arrows) that overlap with RyR1. Scale bars: 10 µm (D,E); 5 µm (D′,E′).
|
